This is the multi-page printable view of this section.
Click here to print.
Return to the regular view of this page.
OpenClarity Documentation
OpenClarity is an open source tool for agentless detection and management of Virtual Machine
Software Bill Of Materials (SBOM) and security threats such as vulnerabilities, exploits, malware, rootkits, misconfigurations and leaked secrets.
Join OpenClarity’s Slack channel to hear about the latest announcements and upcoming activities. We would love to get your feedback!
Table of Contents
Why OpenClarity?
Virtual machines (VMs) are the most used service across all hyperscalers. AWS,
Azure, GCP, and others have virtual computing services that are used not only
as standalone VM services but also as the most popular method for hosting
containers (for example, Docker, Kubernetes).
VMs are vulnerable to multiple threats:
- Software vulnerabilities
- Leaked Secrets/Passwords
- Malware
- System Misconfiguration
- Rootkits
There are many very good open source and commercial-based solutions for
providing threat detection for VMs, manifesting the different threat categories above.
However, there are challenges with assembling and managing these tools yourself:
- Complex installation, configuration, and reporting.
- Integration with deployment automation.
- Siloed reporting and visualization.
The OpenClarity project is focused on unifying detection and management of VM security threats in an agentless manner.
For more information on the capabilities of OpenClarity, see Features.
Getting Started
For step-by-step guidance on how to deploy OpenClarity across different environments, including AWS, Azure, GCP, and Docker, see Getting Started and choose your preferred provider for detailed deployment instructions.
Overview
OpenClarity uses a pluggable scanning infrastructure to provide:
- SBOM analysis
- Package and OS vulnerability detection
- Exploit detection
- Leaked secret detection
- Malware detection
- Misconfiguration detection
- Rootkit detection
The pluggable scanning infrastructure uses several tools that can be
enabled/disabled on an individual basis. OpenClarity normalizes, merges and
provides a robust visualization of the results from these various tools.
These tools include:
- SBOM Generation and Analysis
- Vulnerability detection
- Exploits
- Secrets
- Malware
- Misconfiguration
- Rootkits
* Windows only
** Linux and MacOS only
Asset Discovery
The OpenClarity stack supports the automatic discovery of assets in the following providers:
Supported Filesystems
The following filesystem operations are supported on different host types:
| Host | List block devices | Mount Ext2, Ext3, Ext4 | Mount XFS | Mount NTFS |
| Linux | Supported | Supported | Supported | Supported |
| Darwin | Supported | Supported | Supported | Supported |
| Windows | Not supported | Not supported | Not supported | Not supported |
Architecture
A high-level architecture overview is available under OpenClarity Stack.
Roadmap
The OpenClarity project roadmap is available here.
Contributing
If you are ready to jump in and test, add code, or help with documentation,
please follow the instructions on our contributing guide
for details on how to open issues and setup OpenClarity for development and testing.
Code of Conduct
You can view our code of conduct here.
License
Apache License, Version 2.0
1 - Getting Started
The following sections describe the installation of the OpenClarity backend and the CLI, and show you the most common tasks that you can perform with OpenClarity.
1.1 - Deploy on AWS
An AWS CloudFormation template is provided for quick deployment of the OpenClarity environment.
Note: To avoid extra costs (cross-region snapshots), you may want to deploy the OpenClarity AWS CloudFormation template in the same region where the majority of the VMs are that you want to scan with OpenClarity.
The following figure shows the basic AWS resources that the OpenClarity CloudFormation template creates:
-
a VPC with a public and private subnet, and
-
an AWS Internet Gateway (IGW) and NAT Gateway (NGW) into the VPC.

The public subnet (OpenClarityServerSubnet) hosts the OpenClarity Server (OpenClarityServer) EC2 instance. The OpenClarity server houses the scanning configuration, the UI, and other control components. The EC2 instance is assigned an external IPv4 address (EIP) for SSH and web UI access.
The private subnet (OpenClarityScannerSubnet) hosts the VM snapshot instances (EC2) that are scanned for security vulnerabilities.
Prerequisites
Deployment steps
To deploy the OpenClarity AWS CloudFormation Stack, you can:
- click this quick-create link to navigate directly to the AWS CloudFormation console and jump to the wizard instructions, or
- complete the following steps.
-
Download the latest OpenClarity release.
wget https://github.com/openclarity/openclarity/releases/download/v1.1.2/aws-cloudformation-v1.1.2.tar.gz
Alternatively, copy the AWS CloudFormation template file from the project repository to deploy the latest development code and skip the next step.
-
Create a new directory and extract the files.
mkdir aws-cloudformation-v1.1.2
tar -xvzf aws-cloudformation-v1.1.2.tar.gz -C aws-cloudformation-v1.1.2
-
Log in to the AWS CloudFormation console and go to the AWS CloudFormation Stacks section, then select Create Stack > With New Resources (standard).
-
Check Template is ready and Upload a template file, then click Upload a template file/Choose file and upload the previously downloaded CFN template file.

-
In the OpenClarity CloudFormation Stack wizard, set the following:
- Enter a name for the stack.
- Select the InstanceType (defaults to
t2.large for the OpenClarity Server, and the scanner VMs). - Specify the SSH key for the EC2 instance in the KeyName field. You will need this key to connect to OpenClarity.
- Adjust SSHLocation according to your policies.
- Do not change AdvancedConfiguration, unless you are building from a custom registry.
- Click NEXT.
- (Optional) Add tags as needed for your environment. You can use the defaults unless you need to adjust for your own policies.
- Click NEXT, then scroll to the bottom of the screen, and check I acknowledge….
- Click SUBMIT.
-
Once the stack is deployed successfully, copy the OpenClarity SSH address from the Outputs tab.

-
Open an SSH tunnel to OpenClarity the server
ssh -N -L 8080:localhost:80 -i "<Path to the SSH key specified during install>" ubuntu@<OpenClarity SSH Address copied during install>
-
Access the OpenClarity UI.
-
Open the OpenClarity UI in your browser at http://localhost:8080/. The dashboard opens.
-
(Optional) If needed, you can access the API at http://localhost:8080/api. For details on the API, see the API reference.

Next steps
Complete the First Tasks on the UI.
1.2 - Deploy on Azure
Prerequisites
Deployment steps
-
Click here to deploy OpenClarity’s custom template.
-
Fill out the required Project details and Instance details in the Basics tab.

You can set the following parameters:
| Parameter | Required | Description |
| Subscription | True | Azure subscription where resources will be billed. |
| Region | False | Azure region where resources will be deployed. |
| OpenClarity Deploy Postfix | True | Postfix for Azure resource group name (e.g. openclarity-<postfix>). |
| OpenClarity Server SSH Username | True | SSH Username for the OpenClarity Server Virtual Machine. |
| OpenClarity Server SSH Public Key | True | SSH Public Key for the OpenClarity Server Virtual Machine. Paste the contents of ~/.ssh/id_rsa2.pub here. |
| OpenClarity Server VM Size | True | The size of the OpenClarity Server Virtual Machine. |
| OpenClarity Scanner VMs Size | True | The size of the OpenClarity Scanner Virtual Machines. |
| Security Type | False | Security Type of the OpenClarity Server Virtual Machine, e.g. TrustedLaunch (default) or Standard. |
-
(Optional) In the Advanced tab, modify the Container Image for each service if a specific OpenClarity version is required. Then, select the delete policy and the database.

| Parameter | Required | Description |
| Service Container Image | True | Docker Container Image to use for each service. |
| Asset Scan Delete Policy | True | Delete Policy for resources created when performing an asset scan, e.g. Always, OnSuccess or Never. |
| Database To Use | True | Database type to use, e.g. SQLite, PostgreSQL or External PostgreSQL. |
-
Click Review + create to create the deployment.
-
Once the deployment is completed successfully, copy the OpenClarity SSH address from the Outputs tab.

-
Open an SSH tunnel to OpenClarity the server
ssh -N -L 8080:localhost:80 -i "<Path to the SSH key specified during install>" ubuntu@<OpenClarity SSH Address copied during install>
-
Access the OpenClarity UI.
-
Open the OpenClarity UI in your browser at http://localhost:8080/. The dashboard opens.
-
(Optional) If needed, you can access the API at http://localhost:8080/api. For details on the API, see the API reference.
Next steps
Complete the First Tasks on the UI.
1.3 - Deploy on Docker
Prerequisites
Deployment steps
To run OpenClarity in Docker on a local machine, complete the following steps.
-
Download the latest OpenClarity release.
wget https://github.com/openclarity/openclarity/releases/download/v1.1.2/docker-compose-v1.1.2.tar.gz
-
Create a new directory, extract the files and navigate to the directory.
mkdir docker-compose-v1.1.2
tar -xvzf docker-compose-v1.1.2.tar.gz -C docker-compose-v1.1.2
cd docker-compose-v1.1.2
-
Start every control plane element with the docker compose file.
docker compose --project-name openclarity --file docker-compose.yml up -d --wait --remove-orphans
The output should be similar to:
[+] Running 14/14
⠿ Network openclarity                        Created                                                       0.2s
⠿ Volume "openclarity_grype-server-db"       Created                                                       0.0s
⠿ Volume "openclarity_apiserver-db-data"     Created                                                       0.0s
⠿ Container openclarity-orchestrator-1       Healthy                                                      69.7s
⠿ Container openclarity-yara-rule-server-1   Healthy                                                      17.6s
⠿ Container openclarity-exploit-db-server-1  Healthy                                                      17.7s
⠿ Container openclarity-swagger-ui-1         Healthy                                                       7.8s
⠿ Container openclarity-trivy-server-1       Healthy                                                      26.7s
⠿ Container openclarity-uibackend-1          Healthy                                                      17.6s
⠿ Container openclarity-ui-1                 Healthy                                                       7.7s
⠿ Container openclarity-freshclam-mirror-1   Healthy                                                       7.8s
⠿ Container openclarity-grype-server-1       Healthy                                                      37.3s
⠿ Container openclarity-gateway-1            Healthy                                                       7.7s
⠿ Container openclarity-apiserver-1          Healthy                                                      17.7s
Please note that the image_override.env file enables you to use the images you build yourself. You can override parameters in the docker-compose.yml by passing a custom env file to the docker compose up command via the --env-file flag. The /installation/docker/image_override.env file contains an example overriding all the container images.
-
Check the running containers in the Docker desktop.

-
Access the OpenClarity UI. Navigate to http://localhost:8080/ in your browser.
Next steps
Complete the First Tasks on the UI.
Clean up steps
-
After you’ve finished your tasks, stop the running containers.
docker compose --project-name openclarity --file docker-compose.yml down --remove-orphans
1.4 - Deploy on GCP
Prerequisites
- You can install OpenClarity using the CLI, so you have to have gcloud on your
computer available beforehand. For details on installing and configuring gcloud, see the official installation guide.
- If you have already installed OpenClarity before and want to reinstall it, you have to manually restore deleted roles that were created during the previous installation.
Deployment steps
To install OpenClarity on Google Cloud Platform (GCP), complete the following steps.
-
Download the newest GCP deployment release from GitHub and extract it to any location.
wget https://github.com/openclarity/openclarity/releases/download/v1.1.2/gcp-deployment-v1.1.2.tar.gz
-
Create a new directory, extract the files and navigate to the directory.
mkdir gcp-deployment-v1.1.2
tar -xvzf gcp-deployment-v1.1.2.tar.gz -C gcp-deployment-v1.1.2
cd gcp-deployment-v1.1.2
-
Copy the example configuration file and rename it.
cp openclarity-config.example.yaml openclarity-config.yaml
-
The following table contains all the fields that can be set in the openclarity-config.yaml file. You have to set at
least the required ones.
| Field | Required | Default | Description |
zone | yes | | The Zone to locate the OpenClarity server. |
machineType | yes | | The machine type for the OpenClarity server. |
region | yes | | The region to locate OpenClarity. |
scannerMachineType | | e2-standard-2 | Machine type to use for the Scanner instances. |
scannerSourceImage | | projects/ubuntu-os-cloud/global/images/ubuntu-2204-jammy-v20230630 | Source image to use for the Scanner instances. |
databaseToUse | | SQLite | The database that OpenClarity should use. |
apiserverContainerImage | | ghcr.io/openclarity/openclarity-apiserver:1.1.2 | The container image to use for the apiserver. |
orchestratorContainerImage | | ghcr.io/openclarity/openclarity-orchestrator:1.1.2 | The container image to use for the orchestrator. |
uiContainerImage | | ghcr.io/openclarity/openclarity-ui:1.1.2 | The container image to use for the ui. |
uibackendContainerImage | | ghcr.io/openclarity/openclarity-ui-backend:1.1.2 | The container image to use for the uibackend. |
scannerContainerImage | | ghcr.io/openclarity/openclarity-cli:1.1.2 | The container image to use for the scanner. |
exploitDBServerContainerImage | | ghcr.io/openclarity/exploit-db-server:v0.2.4 | The container image to use for the exploit db server. |
trivyServerContainerImage | | docker.io/aquasec/trivy:0.41.0 | The container image to use for the trivy server. |
grypeServerContainerImage | | ghcr.io/openclarity/grype-server:v0.7.0 | The container image to use for the grype server. |
freshclamMirrorContainerImage | | ghcr.io/openclarity/freshclam-mirror:v0.2.0 | The container image to use for the fresh clam mirror server. |
postgresqlContainerImage | | docker.io/bitnami/postgresql:12.14.0-debian-11-r28 | The container image to use for the postgresql server. |
assetScanDeletePolicy | | Always | When asset scans should be cleaned up after scanning. |
postgresDBPassword | | | Postgres DB password. Only required if DatabaseToUse is Postgresql. |
externalDBName | | | DB to use in the external DB. Only required if DatabaseToUse is External. |
externalDBUsername | | | Username for the external DB. Only required if the DatabaseToUse is External. |
externalDBPassword | | | Password for the external DB. Only required if the DatabaseToUse is External. |
externalDBHost | | | Hostname or IP for the external DB. Only required if the DatabaseToUse is External. |
externalDBPort | | | Port for the external DB. Only required if the DatabaseToUse is External. |
-
Deploy OpenClarity using gcloud deployment-manager.
gcloud deployment-manager deployments create <openclarity deployment name> --config openclarity-config.yaml
-
Open an SSH tunnel to the OpenClarity server with gcloud. For further information on how to create an SSH connection
with gcloud to one of your instances check the official page.
gcloud compute ssh --project=<project id> --zone=<zone name> <name of your VM> -- -NL 8080:localhost:80
-
Access the OpenClarity UI.
-
Open the OpenClarity UI in your browser at http://localhost:8080/. The dashboard opens.
-
(Optional) If needed, you can access the API at http://localhost:8080/api. For details on the API, see the API reference.
Next steps
Complete the First Tasks on the UI.
Uninstall OpenClarity
-
You can uninstall OpenClarity using the gcloud manager.
gcloud deployment-manager deployments delete <openclarity deployment name>
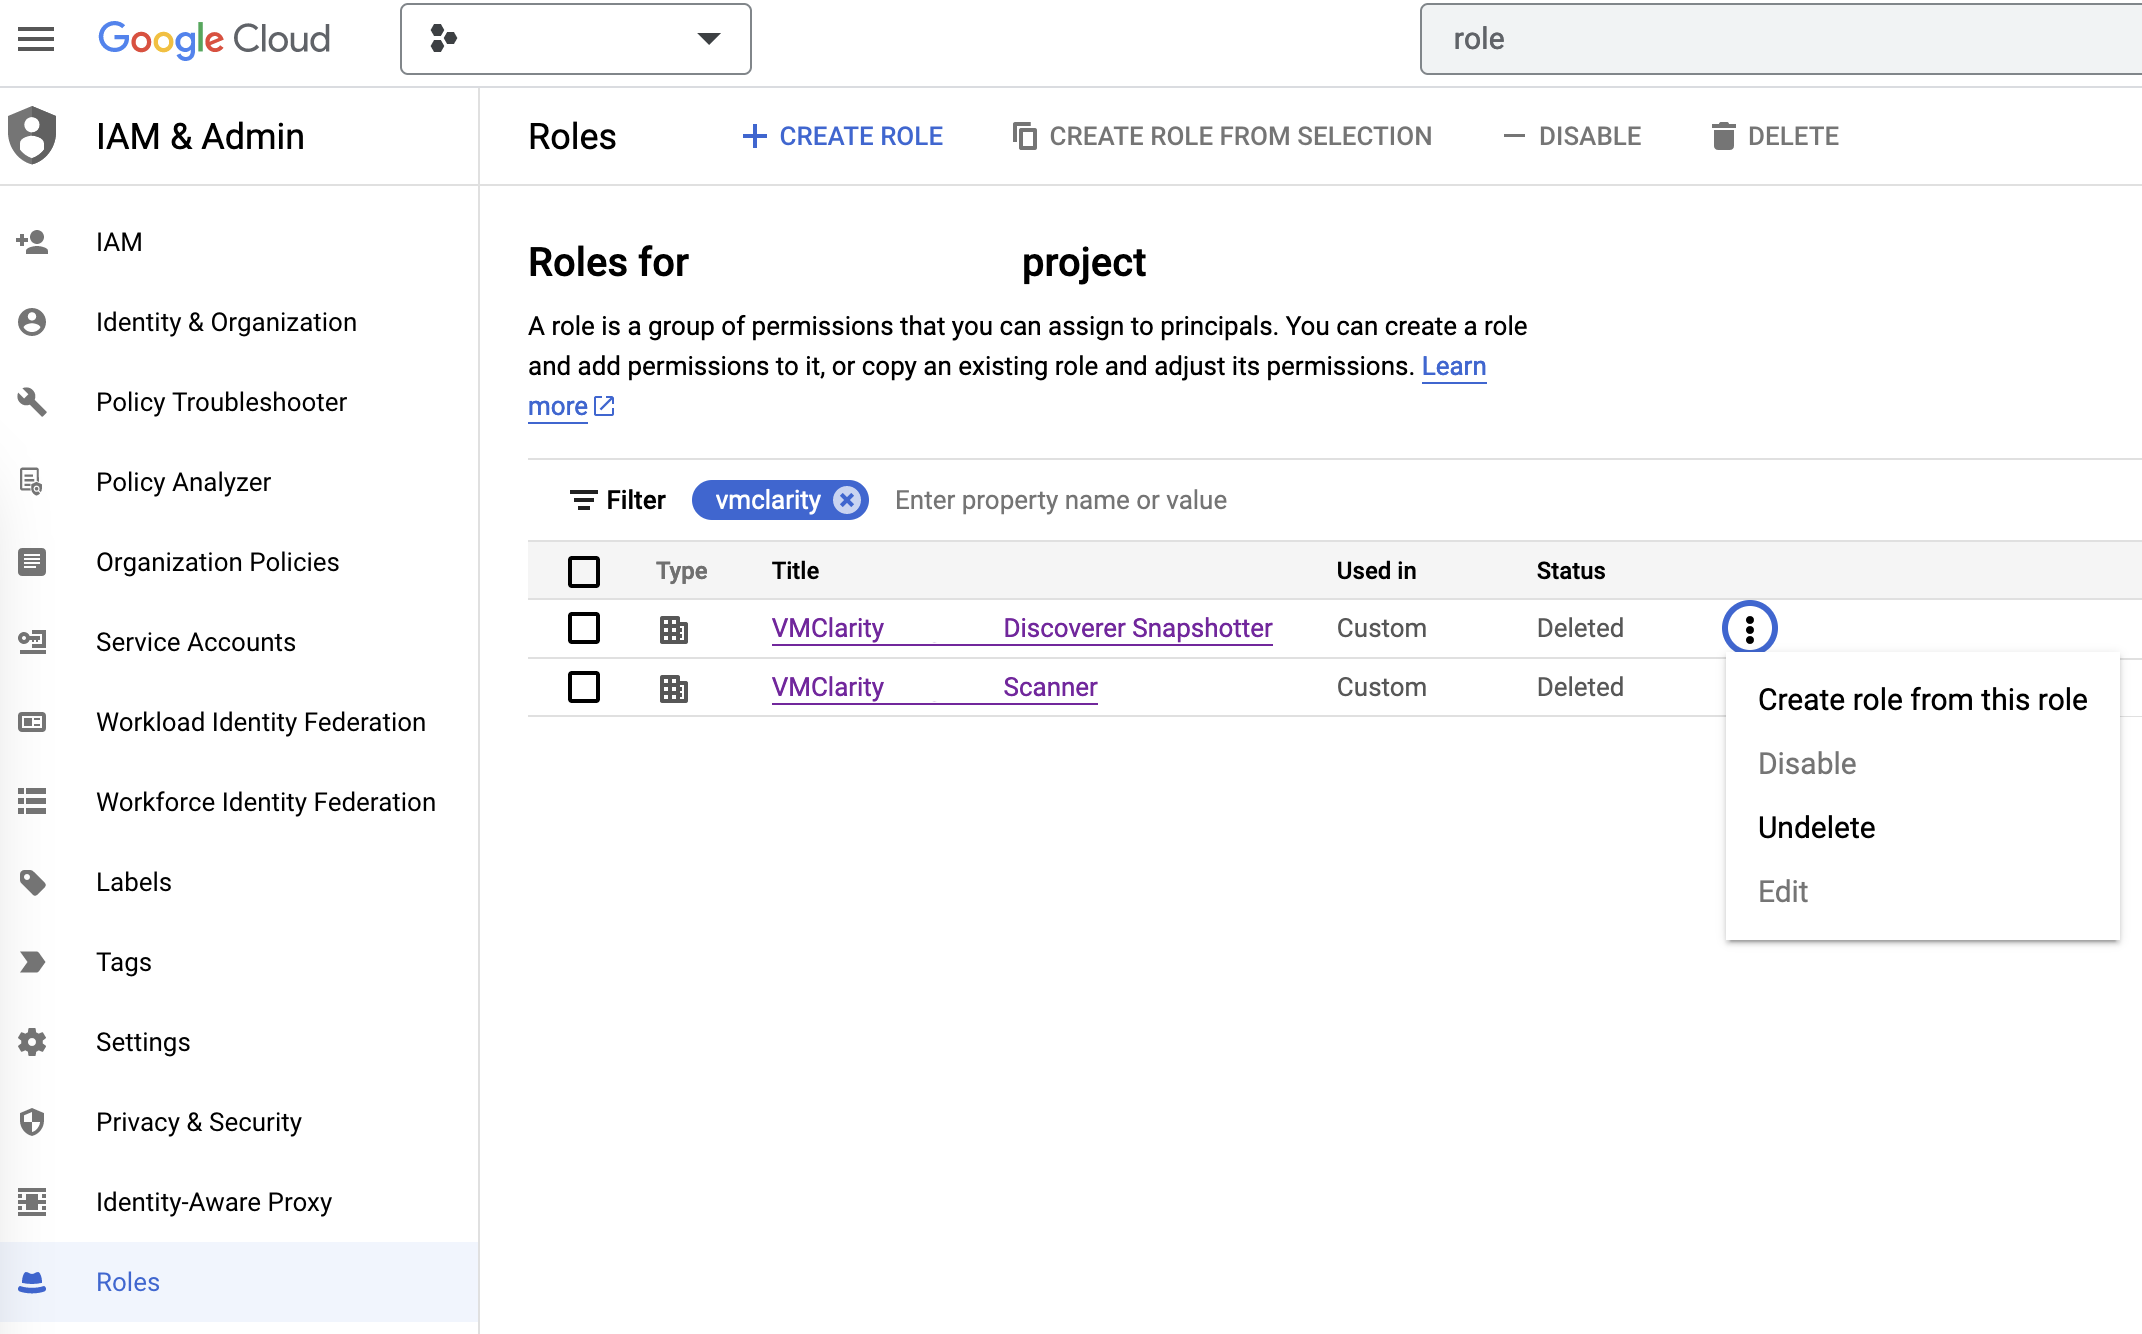
Restore deleted roles
-
On the IAM & Admin page on GCP, open the Roles tab, then search for OpenClarity in the filter input.
-
Now manually undelete the Discoverer Snapshotter and Scanner roles to set their statuses from Deleted to Enabled.
1.5 - Deploy on Kubernetes
Prerequisites
- Install a tool to run local Kubernetes clusters. Here, Kind is used as the default option for creating a local cluster.
- Helm to install OpenClarity.
Deployment steps
To deploy OpenClarity to your Kubernetes cluster, complete the following steps.
-
Create a Kubernetes cluster.
kind create cluster --name openclarity-k8s
-
Ensure the Kubernetes cluster is up and running. If you’re using kind, you can check the status of your clusters with the following command:
-
Use Helm to install OpenClarity. Run the following command:
helm install openclarity oci://ghcr.io/openclarity/charts/openclarity --version 1.1.2 \
    --namespace openclarity --create-namespace \
    --set orchestrator.provider=kubernetes \
    --set orchestrator.serviceAccount.automountServiceAccountToken=true
-
Verify that all the OpenClarity pods have been successfully deployed by executing the following command:
kubectl get pods -n openclarity
-
Wait until all pods are in the Running state or have completed their initialization.
-
Once the pods are ready, start port forwarding to access the OpenClarity gateway service. Use the following command to forward traffic from your local machine to the cluster:
kubectl port-forward -n openclarity service/openclarity-gateway 8080:80
-
Access the OpenClarity UI by navigating to http://localhost:8080/ in your web browser.
Next steps
Complete the First Tasks on the UI.
Clean up steps
-
Uninstall OpenClarity with Helm. Run the following command:
helm uninstall openclarity --namespace openclarity
-
Delete the Kubernetes cluster.
kind delete clusters openclarity-k8s
1.6 - First Tasks on the UI
-
Open the UI.
-
Open the OpenClarity UI in your browser at http://localhost:8080/. The dashboard opens.
-
(Optional) If needed, you can access the API at http://localhost:8080/api. For details on the API, see the API reference.
-
Click on the Scans icon. In the Scans window, you can create a new scan configuration.

-
Click New scan configuration.

-
Follow the steps of the New scan config wizard to name the scan, and optionally narrow the scope down with an
OData query.

-
Enable the scan types you want to perform.

-
Select the time and/or frequency of the scans. To run the scan immediately, select Now.

-
Optionally, adjust the number of scanners to run in parallel and whether to use spot instances on cloud providers, or
not.

-
Click Save. The new scan appears on the Scan Configurations tab.

-
Once a scan is finished, you can browse around the various OpenClarity UI features and investigate the security scan reports.

2 - Concepts
The following sections give you the concepts and background information about the scans provided by OpenClarity.
2.1 - Software Bill of Materials
A software bill of materials (SBOM) is a list of all the components, libraries, and other dependencies that make up a software application, along with information about the versions, licenses, and vulnerabilities associated with each component. They are formal, structured documents detailing the components of a software product and its supply chain relationships.
SBOMs are important because organizations increasingly rely on open source and third-party software components to build and maintain their applications. These components can introduce security vulnerabilities and must be adequately managed and updated. SBOMs help you understand what open source and third-party components are used in your applications, and identify and address any security vulnerabilities.
Under specific scenarios, generating and publishing SBOMs is mandatory for compliance with regulations and industry standards that require organizations to disclose the use of open source and third-party software in their products.
SBOM Standards
There are several related standards, for example, CycloneDX, SPDX, SWID.
SPDX (Software Package Data Exchange) is a standard format for communicating a software package’s components, licenses, and copyrights. It is commonly used to document the open source components included in a proprietary software product. SPDX files can be easily read and understood by humans and machines, making it easy to track and manage open source components in a software project. SPDX format is supported by Linux Foundation.
CycloneDX is an open source standard for creating software bill of materials files. It is like SPDX in that it documents the components and licenses associated with a software package, but it is specifically designed for use in software supply chain security. CycloneDX is a more lightweight format compared to SPDX, which is intended to be more detailed. CycloneDX format is supported by OWASP.
SBOM Architecture
A typical SBOM architecture can be laid out as a tree-like dependency graph with the following key elements:
- Component inventory: Information about the components, libraries, and other assets used in the software, including version numbers, licenses, and vulnerabilities.
- Dependency mapping: A map of relationships between different components and libraries, showing how they depend on each other and how changes to one may impact the other.
- License management: It should also include information about the licenses of the components and libraries used to ensure that the software complies with legal and ethical obligations.
SBOM Generators
There are two typical ways to generate SBOM: during the build process, or after the build and deployment using a Software Composition Analysis tool. Trivy and Syft are two noteworthy open source generators among many other generators, including open source and commercial. Both use CycloneDX format. It is also important to note that not all SBOMs can be generated equally. Each generator may pick up a few language libraries better than the others based on its implementation. It might take multiple runs through a few different types of generators to draw comprehensive insights.
OpenClarity content analyzer integrates with the following SBOM generators:
Multiple SBOMs for Accuracy
OpenClarity can run multiple SBOM generators in parallel, and unify their results to generate a more accurate document.
In such cases, OpenClarity compiles a merged SBOM from multiple open source analyzers, and delivers a comprehensive SBOM document report. Although OpenClarity does not generate SBOMs, it integrates with popular generators so that a combined document can provide amplified inputs that can be further analyzed using vulnerability scanners. Leveraging multiple SBOM documents can improve visibility into software dependency posture.
OpenClarity formats the merged SBOM to comply with the input requirements of vulnerability scanners before starting vulnerability scans.
Note: OpenClarity can merge vulnerability scans from various sources like Grype and Trivy to generate a robust vulnerability scan report.
Scan SBOM Documents for Vulnerabilities
You can feed the generated SBOM documents to vulnerability scanners, which analyze the SBOMs and generate a vulnerability report detailing all known and fixed CVEs of the software components listed by SBOM.
2.1.1 - SBOM Output Format
The openclarity-cli scan command can format the resulting SBOM into different formats to integrate with another system. The supported formats are:
| Format | Configuration Name |
| CycloneDX JSON (default) | cyclonedx-json |
| CycloneDX XML | cyclonedx-xml |
| SPDX JSON | spdx-json |
| SPDX Tag Value | spdx-tv |
| Syft JSON | syft-json |
CAUTION:
OpenClarity processes CycloneDX internally, the other formats are supported through a conversion. The conversion process can be lossy due to incompatibilities between formats, therefore in some cases not all fields/information are present in the resulting output.
To configure the openclarity-cli to use a format other than the default, the sbom.output_format config parameter can be used with the configuration name from above:
# Create config based on https://github.com/openclarity/openclarity/blob/main/.families.yaml
cat <<EOF > config.yml
sbom:
  enabled: true
  analyzers_list:
    - "syft"
  inputs:
    - input: "/dir-to-scan"
      input_type: "rootfs"
  output_format: "cyclonedx-json"
EOF

# Run scan
openclarity-cli scan --config config.yml
For more information the CLI configuration, see the Example CLI Configuration.
2.2 - Vulnerability Scanning
Vulnerability scanning identifies weak spots in software code and dependencies. Vulnerability scanners can identify infrastructure, networks, applications, or website vulnerabilities. These tools scan various target systems for security flaws that attackers could exploit.
The scanners use the information contained in the SBOM to identify vulnerabilities and potential security risks within software applications. Vulnerability scanners use SBOM information to:
- Identify vulnerable components: Scanners use the SBOM to identify a software application’s components, then cross-reference this information with known vulnerabilities and security issues to identify vulnerable components within the software.
- Prioritize vulnerabilities: After the vulnerability scanner has identified all vulnerable components within the software application, it uses the SBOM to prioritize the vulnerabilities so you can focus on the most critical vulnerabilities.
- Identify supply chain risks: SBOMs provide visibility into the software supply chain, enabling vulnerability scanners to identify third-party or security risks. As a result, organizations can mitigate supply chain risks and reduce their overall security exposure.
- Track changes and updates: Software vulnerability scanners use SBOM information to determine whether software changes have introduced new vulnerabilities or security risks.
The SBOM is a critical tool for vulnerability scanners, providing the information needed to identify, prioritize, and mitigate security risks within software applications. In addition, scanners also rely on other types of inputs, as listed below.
OpenClarity and Vulnerability Scanning
OpenClarity isn’t a vulnerability scanner but integrates with top opensource vulnerability scanners. It also helps with prioritization and risk management by visualization and filtering. It is often necessary to prioritize CVEs because of the sheer volume of identified CVEs. With OpenClarity’s vulnerability trending dashboard and APIs, you can locate and double-click into a specific CVE in your application or infrastructure.
OpenClarity features a range of flexible and dynamic filters that help map CVEs down to an application->package->Image level. Additionally, it normalizes reports from multiple scanners and calculates missing CVSS (Common Vulnerability Scoring System) scores.
OpenClarity vulnerability scanner integrates with the following scanners:
OpenClarity supports both automatic scans to find common vulnerabilities quickly and efficiently, and manual scans to help verify automated scans, and also to help identify more complex and less common vulnerabilities. In addition to conventional scans, OpenClarity also provides multi-scanner integration.
Multi-scanner Architecture
OpenClarity infrastructure enables multiple scanners’ configuration and simultaneous operation. Scanners in OpenClarity are designed to work in parallel.
The following figure shows the multi-scanner architecture for vulnerability scanning: OpenClarity preprocesses the SBOMs so they conform to the specific formatting requirements of the specific scanner. Each scanner may have different types and unique formatting expectations. The scanners analyze the incoming data and generate vulnerability outputs in their native formats.

OpenClarity can merge the vulnerability reports of different scanners, to include severity levels, sources, and available fixes. These reports serve as valuable outputs, allowing you to filter and focus on specific areas of vulnerabilities for further investigation and resolution.
Run Vulnerability Scans
For details on running vulnerability scans with OpenClarity, see the Getting Started.
2.3 - Plugins
Plugins provide additional scanning capabilities to OpenClarity ecosystem.
Project structure:
- runner - Provides necessary logic to manage scanner plugins in OpenClarity.
- sdk - Language-specific libraries, templates, and examples to aid with the implementation of scanner plugins.
- store - Collection of available plugins that can be directly used in OpenClarity.
Requirements
Scanner plugins are distributed as containers and require Docker Engine on the host that runs the actual scanning via
OpenClarity CLI to work.
Support
List of supported environments:
- AWS
- GCP
- Azure
- Docker
List of unsupported environments:
- Kubernetes - We plan on adding plugin support to Kubernetes once we have dealt with all the security considerations.
Note: Plugin support has been tested against OpenClarity installation artifacts for the given environments.
Usage
You can start using plugins via Plugins Store.
For example, you can pass the .families.yaml scan config file defined below to the OpenClarity CLI scan command.
This configuration uses KICS scanner to scan /tmp dir for IaC security misconfigurations.
# --- .families.yaml
plugins:
  enabled: true
  scanners_list:
    - "kics"
  inputs:
    - input: "/tmp"
      input_type: "rootfs"
  scanners_config:
    kics:
      image_name: "ghcr.io/openclarity/openclarity-plugin-kics:latest"
      config: "{}"
SDKs
You can use one of available SDKs in your language of choice to quickly develop scanner plugins for OpenClarity.
List of supported languages:
3 - Using OpenClarity
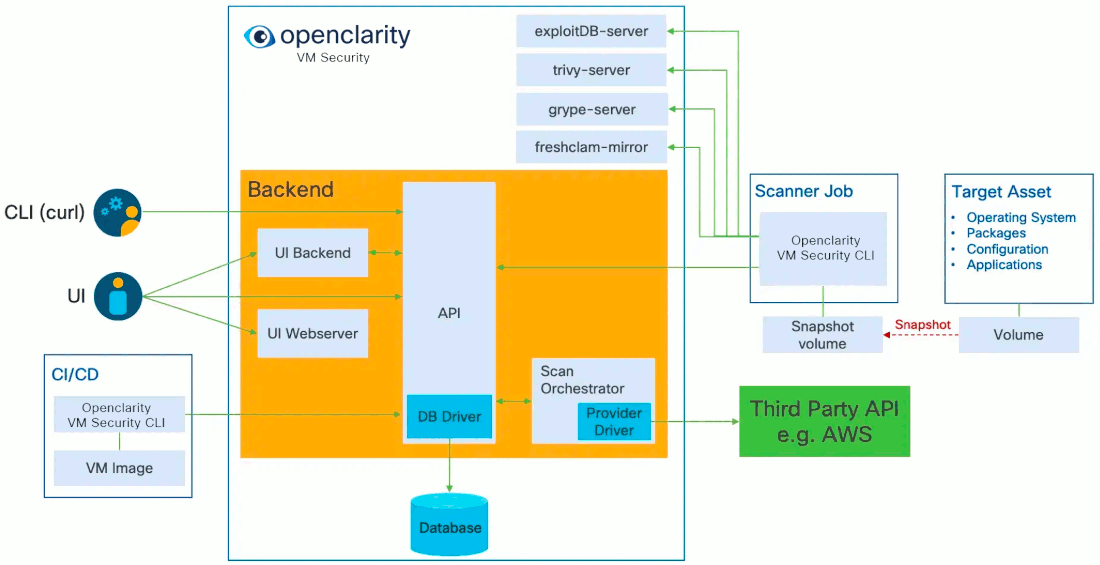
3.1 - OpenClarity Stack
Today, OpenClarity has two halves, the OpenClarity control plane, and the
OpenClarity CLI.
The OpenClarity control plane includes several microservices:
-
API Server: The OpenClarity API for managing all objects in the OpenClarity
system. This is the only component in the system which talks to the DB.
-
Orchestrator: Orchestrates and manages the life cycle of OpenClarity
scan configs, scans and asset scans. Within the Orchestrator there is a
pluggable “provider” which connects the orchestrator to the environment to be
scanned and abstracts asset discovery, VM snapshotting as well as creation of
the scanner VMs. (Note The only supported provider today is AWS, other
hyperscalers are on the roadmap)
-
UI Backend: A separate backend API which offloads some processing from
the browser to the infrastructure to process and filter data closer to the
source.
-
UI Webserver: A server serving the UI static files.
-
DB: Stores the OpenClarity objects from the API. Supported options are
SQLite and Postgres.
-
Scanner Helper services: These services provide support to the OpenClarity
CLI to offload work that would need to be done in every scanner, for example
downloading the latest vulnerability or malware signatures from the various DB
sources. The components included today are:
- grype-server: A rest API wrapper around the grype vulnerability scanner
- trivy-server: Trivy vulnerability scanner server
- exploitDB server: A test API which wraps the Exploit DB CVE to exploit mapping logic
- freshclam-mirror: A mirror of the ClamAV malware signatures
The OpenClarity CLI contains all the logic for performing a scan, from mounting
attached volumes and all the pluggable infrastructure for all the families, to
exporting the results to OpenClarity API.
These components are containerized and can be deployed in a number of different
ways. For example our cloudformation installer deploys OpenClarity on a VM using
docker in an dedicated AWS Virtual Private Cloud (VPC).
Once the OpenClarity server instance has been deployed, and the scan
configurations have been created, OpenClarity will discover VM resources within
the scan range defined by the scan configuration (e.g., by region, instance
tag, and security group). Once the asset list has been created, snapshots of
the assets are taken, and a new scanner VM are launched using the snapshots as
attached volumes. The OpenClarity CLI running within the scanner VM will perform
the configured analysis on the mounted snapshot, and report the results to the
OpenClarity API. These results are then processed by the OpenClarity backend into
findings.
3.2 -
Initiate scan using the cli
Reporting results into file
./bin/openclarity-cli scan --config ~/testConf.yaml -o outputfile
If we want to report results to the OpenClarity backend, we need to create asset and asset scan object before scan because it requires asset-scan-id
Reporting results to OpenClarity backend
ASSET_ID=$(./bin/openclarity-cli asset-create --file assets/dir-asset.json --server http://localhost:8080/api) --jsonpath {.id}
ASSET_SCAN_ID=$(./bin/openclarity-cli asset-scan-create --asset-id $ASSET_ID --server http://localhost:8080/api) --jsonpath {.id}
./bin/openclarity-cli scan --config ~/testConf.yaml --server http://localhost:8080/api --asset-scan-id $ASSET_SCAN_ID
Using one-liner:
./bin/openclarity-cli asset-create --file docs/assets/dir-asset.json --server http://localhost:8080/api --update-if-exists --jsonpath {.id} | xargs -I{} ./bin/openclarity-cli asset-scan-create --asset-id {} --server http://localhost:8080/api --jsonpath {.id} | xargs -I{} ./bin/openclarity-cli scan --config ~/testConf.yaml --server http://localhost:8080/api --asset-scan-id {}
3.2.1 - Example CLI Configuration
This section provides a sample configuration for scanner families supported by
the OpenClarity CLI tool. Each family can be enabled or disabled, and configured
with specific options. The configuration is used to define which scanners to
run, what inputs to scan, and the configuration for each scanner.
# This file contains a sample configuration for scanner families supported by the OpenClarity CLI tool.
# Each family can be enabled or disabled, and configured with specific options.
# The configuration is used to define the scanners to run, the inputs to scan, and the configuration for each scanner.

# SBOM (Software Bill of Materials) scanner family
sbom:
  enabled: false # Enable or disable SBOM scanner family
  analyzers_list: # List of analyzers to run
    - "syft"
    - "trivy"
    - "windows"
    - "gomod"
  inputs: # List of inputs to scan
    - input: "node:slim"
      input_type: "image" # Type of input (image, rootfs, etc.)
    # - input: "/mnt"
    #   input_type: "rootfs"
    # - input: "nginx:1.10"
    #   input_type: "image"
  # merge_with: # Merge multiple SBOMs into one
  #  - sbom_path: "nginx.11.cdx.json" # Path to SBOM file to merge with
  local_image_scan: true # Scan images from local docker daemon (true) or from remote registry (false)
  registry:
    skip-verify-tls: false # Skip TLS verification
    use-http: false # Use HTTP instead of HTTPS
    auths: # Registry authentication
      authority: "authority"
      username: "username"
      password: "password"
      token: "token"
  output_format: "cyclonedx-json" # Output format for SBOMs (cyclonedx-json, cyclonedx-xml, spdx-json, spdx-tv, syft-json)
  analyzers_config: # Configuration for each analyzer
    syft:
      scope: "Squashed" # Scope of the scan (squashed, all-layers)
      exclude_paths: # Paths to exclude from the scan
        - "./dev"
        - "./proc"
      ## Overrides parent sbom configs
      # local_image_scan: ...
      # registry: ...
    trivy:
      timeout: 300 # Timeout in seconds
      cache_dir: /tmp/.trivy/cache # Cache directory
      temp_dir: /tmp/.trivy/ # Temp directory
      ## Overrides parent sbom configs
      # local_image_scan: ...
      # registry: ...

# Vulnerabilities scanner family
vulnerabilities:
  enabled: false # Enable or disable vulnerabilities scanner family
  scanners_list: # List of scanners to run
    - "grype"
    - "trivy"
  inputs: # List of inputs to scan
    - input: "nginx:1.12"
      input_type: "image" # Type of input (image, rootfs, etc.)
    # - input: "nginx:1.13"
    #   input_type: "image"
    - input: "/mnt/"
      input_type: "sbom"
  local_image_scan: true # Scan images from local docker daemon (true) or from remote registry (false)
  registry: # Registry configuration
    skip-verify-tls: false
    use-http: false
    auths:
      authority: "authority"
      username: "username"
      password: "password"
      token: "token"
  scanners_config: # Configuration for each scanner
    grype:
      mode: "LOCAL" # Mode of operation (LOCAL, REMOTE). LOCAL uses local database, REMOTE uses Grype server.
      local_grype_config:
        update_db: true # Update the database
        db_root_dir: "/tmp/" # Database root directory
        listing_url: "https://toolbox-data.anchore.io/grype/databases/listing.json" # Listing URL
        max_allowed_built_age: "120h" # Max allowed built age
        listing_file_timeout: "60s" # Listing file timeout
        update_timeout: "60s" # Update timeout
        scope: "squashed" # Scope of the scan (squashed, all-layers)
        ## Overrides parent sbom configs
        # local_image_scan: ...
        # registry: ...
      remote_grype_config:
        grype_server_address: "" # Grype server address
        grype_server_timeout: "2m" # Grype server timeout
        grype_server_schemes: [] # Grype server schemes
    trivy:
      timeout: 300 # Timeout in seconds
      cache_dir: /tmp/.trivy/cache # Cache directory
      temp_dir: /tmp/.trivy/ # Temp directory
      server_addr: "trivy.example.com" # Trivy server address
      server_token: "token" # Trivy server token
      ## Overrides parent sbom configs
      # registry: ...

# Secrets scanner family
secrets:
  enabled: false # Enable or disable secrets scanner family
  scanners_list: # List of scanners to run
    - "gitleaks"
  strip_input_paths: false # Strip input paths from the output
  inputs: # List of inputs to scan
    - input: "/"
      input_type: "rootfs"
  scanners_config: # Configuration for each scanner
    gitleaks:
      binary_path: "/usr/local/bin/gitleaks" # Path to gitleaks binary

# Exploits scanner family
exploits:
  enabled: false # Enable or disable exploits scanner family
  scanners_list: # List of scanners to run
    - "exploitdb"
  inputs: # List of inputs to scan
    - input: "CVE-2024-5535,CVE-2023-3446"
      input_type: "csv"
  scanners_config: # Configuration for each scanner
    exploit_db:
      base_url: "http://localhost:1326" # Base URL for the ExploitDB server

# Misconfigurations scanner family
misconfiguration:
  enabled: false # Enable or disable misconfigurations scanner family
  scanners_list: # List of scanners to run
    - "cisdocker"
    - "lynis"
    - "fake"
  strip_input_paths: false # Strip input paths from the output
  inputs: # List of inputs to scan
    - input: "/"
      input_type: "rootfs"
  scanners_config: # Configuration for each scanner
    cisdocker:
      timeout: "60s" # Timeout
      registry: # Registry configuration
        skip-verify-tls: false
        use-http: false
        auths:
          authority: "authority"
          username: "username"
          password: "password"
          token: "token"
    lynis:
      binary_path: "/usr/local/bin/lynis" # Path to Lynis binary

# InfoFinder scanner family
infofinder:
  enabled: false # Enable or disable infofinder scanner family
  scanners_list: # List of scanners to run
    - "sshTopology"
  strip_input_paths: false # Strip input paths from the output
  inputs: # List of inputs to scan
    - input: "/"
      input_type: "rootfs"
  scanners_config: {}

# Malware scanner family
malware:
  enabled: false # Enable or disable malware scanner family
  scanners_list: # List of scanners to run
    - "clam"
    - "yara"
  strip_input_paths: false # Strip input paths from the output
  inputs: # List of inputs to scan
    - input: "/"
      input_type: "rootfs"
  scanners_config: # Configuration for each scanner
    clam:
      freshclam_binary_path: "/usr/local/bin/freshclam" # Path to freshclam binary
      freshclam_config_path: "/etc/clamav/freshclam.conf" # Path to freshclam configuration file
      alternative_freshclam_mirror_url: "" # Alternative freshclam mirror URL. Config option cannot include servers under *.clamav.net.
      use_native_clamscan: false # Scan using native clamscan command (true) instead of daemon clamdscan (false)
      clamscan_binary_path: "/usr/local/bin/clamscan" # Path to clamscan binary
      clamscan_exclude_files: # Files to exclude from the scan
        - "^.*\\.log$"
      clamscan_exclude_dirs: # Directories to exclude from the scan
        - "^/sys"
      clam_daemon_binary_path: "/usr/local/bin/clamd" # Path to clamd binary
      clam_daemon_config_path: "/etc/clamav/clamd.conf" # Path to clamd configuration file
      clam_daemon_client_binary_path: "/usr/local/bin/clamdscan" # Path to clamdscan binary
    yara:
      yara_binary_path: "/usr/local/bin/yara" # Path to yara binary
      compiled_rule_url: "" # URL to download compiled rules
      rule_sources: # List of rule sources
        - name: ""
          url: ""
      yarac_binary_path: "/usr/local/bin/yarac" # Path to yarac binary
      cache_dir: "/tmp/.yara" # Cache directory
      directories_to_scan: [] # Directories to scan

# Rootkits scanner family
rootkits:
  enabled: false # Enable or disable rootkits scanner family
  scanners_list: # List of scanners to run
    - "chkrootkit"
  strip_input_paths: false # Strip input paths from the output
  inputs: # List of inputs to scan
    - input: "/"
      input_type: "rootfs"
  scanners_config: # Configuration for each scanner
    chkrootkit:
      binary_path: "/usr/local/bin/chkrootkit" # Path to chkrootkit binary

# Plugins scanner family
plugins:
  enabled: false # Enable or disable plugins scanner family
  binary_mode: false # Use binary mode for plugins
  binary_artifacts_path: "" # Path to binary artifacts
  binary_artifacts_clean: true # Clean binary artifacts after execution
  scanners_list: # List of scanners to run
    - "kics"
  inputs: # List of inputs to scan
    - input: "/"
      input_type: "rootfs"
  scanners_config: # Configuration for each scanner
    kics:
      image_name: "ghcr.io/openclarity/openclarity-plugin-kics:latest" # Image name for KICS plugin
      config: "{\"preview-lines\": 3, \"report-formats\": [\"json\" ], \"platform\": [], \"max-file-size-flag\": 100, \"disable-secrets\": true, \"query-exec-timeout\": 60, \"silent\": true, \"minimal\": true}" # Configuration example for KICS
3.3 - OpenClarity SDKs
See the scanner module for the SDK.
4 - Features
OpenClarity provides a wide range of features for asset scanning and discovery:
- Dashboard
- Fixable vulnerabilities per severity
- Top 5 vulnerable elements (applications, resources, packages)
- New vulnerabilities trends
- Package count per license type
- Package count per programming language
- General counters
- Applications
- Automatic application detection in K8s runtime
- Create/edit/delete applications
- Per application, navigation to related:
- Resources (images/directories)
- Packages
- Vulnerabilities
- Licenses in use by the resources
- Application Resources (images/directories)
- Per resource, navigation to related:
- Applications
- Packages
- Vulnerabilities
- Packages
- Per package, navigation to related:
- Applications
- Linkable list of resources and the detecting SBOM analyzers
- Vulnerabilities
- Vulnerabilities
- Per vulnerability, navigation to related:
- Applications
- Resources
- List of detecting scanners
- K8s Runtime scan
- On-demand or scheduled scanning
- Automatic detection of target namespaces
- Scan progress and result navigation per affected element (applications, resources, packages, vulnerabilities)
- CIS Docker benchmark
- CLI (CI/CD)
- SBOM generation using multiple integrated content analyzers (Syft, cyclonedx-gomod)
- SBOM/image/directory vulnerability scanning using multiple integrated scanners (Grype, Dependency-track)
- Merging of SBOM and vulnerabilities across different CI/CD stages
- Export results to OpenClarity backend
- API
Runtime environment
The following table lists all supported environments and asset types that can be discovered and scanned by OpenClarity.
| Environment | Asset Type | Scope |
| Docker | Containers, Container Images | Docker Daemon |
| Kubernetes | Containers, Container Images | Cluster |
| AWS | Virtual machines | All VMs accessible by credentials |
| Azure | Virtual machines | All VMs accessible by credentials |
| GCP | Virtual machines | All VMs accessible by credentials |
| Local (OS) | Containers, Container Images, Container Image Archives, Filesystem | All assets accessible by OS |
Scanning
The following table lists all supported scanners that can be used when performing a scan on an asset, such as a container image or a directory.
| VMClarity | KubeClarity | OpenClarity |
| SBOM generation and analysis | ✅ | ✅ | ✅ |
| Syft | ✅ | ✅ | ✅ |
| Trivy | ✅ | ✅ | ✅ |
| cyclonedx-gomod | ✅ | ✅ | ✅ |
| Windows Registry | ✅ | ❌ | ✅ |
| Vulnerability detection | ✅ | ✅ | ✅ |
| Grype | ✅ | ✅ | ✅ |
| Trivy | ✅ | ✅ | ✅ |
| Dependency Track | ❌ | ✅ | ❌ |
| Exploits | ✅ | ❌ | ✅ |
| ExploitDB | ✅ | ❌ | ✅ |
| Secrets | ✅ | ❌ | ✅ |
| Gitleaks | ✅ | ❌ | ✅ |
| Malware | ✅ | ❌ | ✅ |
| ClamAV | ✅ | ❌ | ✅ |
| Yara | ✅ | ❌ | ✅ |
| Misconfiguration | ✅ | ✅ | ✅ |
| Lynis | ✅ | ❌ | ✅ |
| CIS Docker Benchmark | ✅ | ✅ | ✅ |
| Rootkits | ✅ | ❌ | ✅ |
| Chrootkit | ✅ | ❌ | ✅ |
| Plugins | ✅ | ❌ | ✅ |
| KICS | ✅ | ❌ | ✅ |
Integrated SBOM Generators and Vulnerability Scanners
OpenClarity content analyzer integrates with the following SBOM generators:
OpenClarity vulnerability scanner integrates with the following scanners:
4.1 - Kubernetes Scanning
For details on performing runtime scans with OpenClarity, see the First Tasks on the UI.
Asset Discovery
The OpenClarity stack supports the automatic discovery of assets in Kubernetes:
4.2 - Docker Scanning
For details on performing runtime scans with OpenClarity, see the First Tasks on the UI.
Asset Discovery
The OpenClarity stack supports the automatic discovery of assets in Docker:
| Asset types | Scope | Installation |
| Docker containers and images | Local Docker daemon | Deploy on Docker |
4.3 - AWS Scanning
For details on performing runtime scans with OpenClarity, see the First Tasks on the UI.
Asset Discovery
The OpenClarity stack supports the automatic discovery of assets in AWS:
| Asset types | Scope | Installation |
| Virtual machines (EC2 instances) | Account (all regions) | Deploy on AWS |
4.4 - GCP Scanning
For details on performing runtime scans with OpenClarity, see the First Tasks on the UI.
Asset Discovery
The OpenClarity stack supports the automatic discovery of assets in GCP:
| Asset types | Scope | Installation |
| Virtual machines | Project | Deploy on GCP |
4.5 - Azure Scanning
For details on performing runtime scans with OpenClarity, see the First Tasks on the UI.
Asset Discovery
The OpenClarity stack supports the automatic discovery of assets in Azure:
4.6 - Scanner Plugins
Plugins provide additional scanning capabilities to OpenClarity ecosystem.
Project structure:
- runner - Provides necessary logic to manage scanner plugins in OpenClarity.
- sdk - Language-specific libraries, templates, and examples to aid with the implementation of scanner plugins.
- store - Collection of available plugins that can be directly used in OpenClarity.
Requirements
Scanner plugins are distributed as containers and require Docker Engine on the host that runs the actual scanning via
OpenClarity CLI to work.
Support
List of supported environments:
- AWS
- GCP
- Azure
- Docker
List of unsupported environments:
- Kubernetes - We plan on adding plugin support to Kubernetes once we have dealt with all the security considerations.
Note: Plugin support has been tested against OpenClarity installation artifacts for the given environments.
Usage
You can start using plugins via Plugins Store.
For example, you can pass the .families.yaml scan config file defined below to the OpenClarity CLI scan command.
This configuration uses KICS scanner to scan /tmp dir for IaC security misconfigurations. See the KICS documentation for further information.
# --- .families.yaml
plugins:
  enabled: true
  scanners_list:
    - "kics"
  inputs:
    - input: "/tmp"
      input_type: "rootfs"
  scanners_config:
    kics:
      image_name: "ghcr.io/openclarity/openclarity-plugin-kics:latest"
      config: "{}"
SDKs
You can use one of available SDKs in your language of choice to quickly develop scanner plugins for OpenClarity.
List of supported languages:
4.7 - Cost Estimation
Available in version 0.6.0 and later. Currently, this feature is exclusively available on AWS.
You can get a preliminary cost estimation before initiating a security scan with OpenClarity. This helps you plan and budget your security assessments more effectively, ensuring that you have a clear understanding of the financial implications before taking action.
To start a new estimation, complete the following steps.
-
Create a new resource called ScanEstimation in the API server. For example, if your POST’s body is the following JSON, it will estimate an SBOM scan on your workload with id i-123456789.
Use the same same scanTemplate in the ScanEstimation than in the ScanConfiguration.
{
  "assetIDs": ["i-123456789"],
  "state": {
    "state": "Pending"
  },
  "scanTemplate": {
    "scope": "contains(assetInfo.tags, '{\"key\":\"scanestimation\",\"value\":\"test\"}')",
    "assetScanTemplate": {
      "scanFamiliesConfig": {
        "sbom": {
          "enabled": true
        }
      }
    }
  }
}
-
Retrieve the object from the <apiserver IP address>:8888/scanEstimations endpoint, and wait for the state to be Done. The totalScanCost of the summary property shows your scan’s cost in USD:
{
   "assetIDs":[
      "d337bd07-b67f-4cf0-ac43-f147fce7d1b2"
   ],
   "assetScanEstimations":[
      {
         "id":"23082244-0fb6-4aca-8a9b-02417dfc95f8"
      }
   ],
   "deleteAfter":"2023-10-08T17:33:52.512829081Z",
   "endTime":"2023-10-08T15:33:52.512829081Z",
   "id":"962e3a10-05fb-4c5d-a773-1198231f3103",
   "revision":5,
   "scanTemplate":{
      "assetScanTemplate":{
         "scanFamiliesConfig":{
            "sbom":{
               "enabled":true
            }
         }
      },
      "scope":"contains(assetInfo.tags, '{\"key\":\"scanestimation\",\"value\":\"test\"}')"
   },
   "startTime":"2023-10-08T15:33:37.513073573Z",
   "state":{
      "state":"Done",
      "stateMessage":"1 succeeded, 0 failed out of 1 total asset scan estimations",
      "stateReason":"Success"
   },
   "summary":{
      "jobsCompleted":1,
      "jobsLeftToRun":0,
      "totalScanCost":0.0006148403,
      "totalScanSize":3,
      "totalScanTime":12
   },
   "ttlSecondsAfterFinished":7200
}
5 -
Configuration
API server
| Environment Variable | Required | Default | Values | Description |
OPENCLARITY_APISERVER_LISTEN_ADDRESS | | 0.0.0.0:8888 | | Address of the API Server to send requests to. Example: localhost:8890 |
OPENCLARITY_APISERVER_HEALTHCHECK_ADDRESS | | 0.0.0.0:8081 | | Bind address to used by the API Server for healthz endpoint. Example: localhost:8082 which will make the health endpoints be available at localhost:8082/healthz/live and localhost:8082/healthz/ready. |
OPENCLARITY_APISERVER_DATABASE_DRIVER | yes | LOCAL | LOCAL, POSTGRES | Database driver type. LOCAL = SQLite, POSTGRES = PostgreSQL. |
OPENCLARITY_APISERVER_DB_NAME | If OPENCLARITY_APISERVER_DATABASE_DRIVER is POSTGRES | | | Database name. |
OPENCLARITY_APISERVER_DB_USER | If OPENCLARITY_APISERVER_DATABASE_DRIVER is POSTGRES | | | Database user. |
OPENCLARITY_APISERVER_DB_PASS | If OPENCLARITY_APISERVER_DATABASE_DRIVER is POSTGRES | | | Database user password. |
OPENCLARITY_APISERVER_DB_HOST | If OPENCLARITY_APISERVER_DATABASE_DRIVER is POSTGRES | | | Database host, e.g. postgresql. |
OPENCLARITY_APISERVER_DB_PORT | If OPENCLARITY_APISERVER_DATABASE_DRIVER is POSTGRES | | | Database port, e.g. 5432. |
OPENCLARITY_APISERVER_ENABLE_DB_INFO_LOGS | | false | | Boolean value whether to enable info logs of the database or not. |
OPENCLARITY_APISERVER_LOCAL_DB_PATH | If OPENCLARITY_APISERVER_DATABASE_DRIVER is LOCAL | | | Path of the database, if LOCAL is used as databse driver, e.g. /data/openclarity.db. |
Orchestrator
| Environment Variable | Required | Default | Values | Description |
OPENCLARITY_ORCHESTRATOR_PROVIDER | yes | aws | aws, azure, gcp, docker | Provider used for Asset discovery and scans. |
OPENCLARITY_ORCHESTRATOR_APISERVER_ADDRESS | yes | | | The URL for the API Server used by the Orchestrator to interact with the API. Example: https://apiserver.example.com:8888/api |
OPENCLARITY_ORCHESTRATOR_HEALTHCHECK_ADDRESS | | :8082 | | Bind address to used by the Orchestrator for healthz endpoint. Example: localhost:8082 which will make the health endpoints be available at localhost:8082/healthz/live and localhost:8082/healthz/ready. |
OPENCLARITY_ORCHESTRATOR_DISCOVERY_INTERVAL | | 2m | | How frequently the Discovery perform discovery of Assets. |
OPENCLARITY_ORCHESTRATOR_CONTROLLER_STARTUP_DELAY | | 7s | | The time interval to wait between controller startups. Do NOT change this parameter unless you know what you are doing. |
OPENCLARITY_ORCHESTRATOR_ASSETSCAN_WATCHER_POLL_PERIOD | | 15s | | How frequently poll the API for events related AssetScan objects. |
OPENCLARITY_ORCHESTRATOR_ASSETSCAN_WATCHER_RECONCILE_TIMEOUT | | 5m | | Time period for reconciling a AssetScan event is allowed to run. |
OPENCLARITY_ORCHESTRATOR_ASSETSCAN_WATCHER_ABORT_TIMEOUT | | 10m | | Time period to wait for the Scanner to gracefully stop on-going scan for AssetScan before setting the state of the AssetScan to Failed. |
OPENCLARITY_ORCHESTRATOR_ASSETSCAN_WATCHER_DELETE_POLICY | | Always | Always, Never, OnSuccess | Whether to delete resources (disk snapshot, container snapshot/images) or not based on the status of the AssetScan. Always means the AssetScan is deleted no matter if it failed or not. Never skip cleaning up the resources created for scanning. OnSuccess means that cleanup is happening only iun case the AssetScan was successful. |
OPENCLARITY_ORCHESTRATOR_ASSETSCAN_WATCHER_SCANNER_CONTAINER_IMAGE | yes | | | The Scanner container image used for running scans. |
OPENCLARITY_ORCHESTRATOR_ASSETSCAN_WATCHER_SCANNER_FRESHCLAM_MIRROR | | | | |
OPENCLARITY_ORCHESTRATOR_ASSETSCAN_WATCHER_SCANNER_APISERVER_ADDRESS | | | | The URL for the API Server used by the Scanner to interact with the API. Example: https://apiserver.example.com:8888/api |
OPENCLARITY_ORCHESTRATOR_ASSETSCAN_WATCHER_SCANNER_EXPLOITSDB_ADDRESS | | | | The URL for the ExploitsDB Server used by the Scanner. |
OPENCLARITY_ORCHESTRATOR_ASSETSCAN_WATCHER_SCANNER_TRIVY_SERVER_ADDRESS | | | | The URL for the Trivy Server used by the Scanner. |
OPENCLARITY_ORCHESTRATOR_ASSETSCAN_WATCHER_SCANNER_TRIVY_SERVER_TIMEOUT | | 5m | | |
OPENCLARITY_ORCHESTRATOR_ASSETSCAN_WATCHER_SCANNER_GRYPE_SERVER_ADDRESS | | | | The URL for the Grype Server used by the Scanner. |
OPENCLARITY_ORCHESTRATOR_ASSETSCAN_WATCHER_SCANNER_GRYPE_SERVER_TIMEOUT | | 2m | | |
OPENCLARITY_ORCHESTRATOR_ASSETSCAN_WATCHER_SCANNER_YARA_RULE_SERVER_ADDRESS | | | | The URL for the Yara Rule Server used by the Scanner. |
OPENCLARITY_ORCHESTRATOR_SCANCONFIG_WATCHER_POLL_PERIOD | | | | How frequently the ScanConfig Watcher poll the API for events related ScanConfig objects. |
OPENCLARITY_ORCHESTRATOR_SCANCONFIG_WATCHER_RECONCILE_TIMEOUT | | | | Time period which a reconciliation for a ScanConfig event is allowed to run. |
OPENCLARITY_ORCHESTRATOR_SCAN_WATCHER_POLL_PERIOD | | | | How frequently the AssetScan Watcher poll the API for events related Scan objects. |
OPENCLARITY_ORCHESTRATOR_SCAN_WATCHER_RECONCILE_TIMEOUT | | | | Time period for reconciling a Scan event is allowed to run. |
OPENCLARITY_ORCHESTRATOR_SCAN_WATCHER_SCAN_TIMEOUT | | | | Time period to wait for the Scan finish before marked it’s state as Failed with Timeout as a reason. |
OPENCLARITY_ORCHESTRATOR_ASSETSCAN_PROCESSOR_POLL_PERIOD | | | | How frequently the AssetScan Processor poll the API for events related AssetScan objects. |
OPENCLARITY_ORCHESTRATOR_ASSETSCAN_PROCESSOR_RECONCILE_TIMEOUT | | | | Time period for processing for a AssetScan result is allowed to run. |
OPENCLARITY_ORCHESTRATOR_ASSETSCAN_ESTIMATION_WATCHER_POLL_PERIOD | | 5s | | |
OPENCLARITY_ORCHESTRATOR_ASSETSCAN_ESTIMATION_WATCHER_RECONCILE_TIMEOUT | | 15s | | |
OPENCLARITY_ORCHESTRATOR_SCAN_ESTIMATION_WATCHER_POLL_PERIOD | | 5s | | |
OPENCLARITY_ORCHESTRATOR_SCAN_ESTIMATION_WATCHER_RECONCILE_TIMEOUT | | 2m | | |
OPENCLARITY_ORCHESTRATOR_SCAN_ESTIMATION_WATCHER_ESTIMATION_TIMEOUT | | 48h | | |
Provider
AWS
| Environment Variable | Required | Default | Description |
OPENCLARITY_AWS_REGION | yes | | Region where the Scanner instance needs to be created |
OPENCLARITY_AWS_SUBNET_ID | yes | | SubnetID where the Scanner instance needs to be created |
OPENCLARITY_AWS_SECURITY_GROUP_ID | yes | | SecurityGroupId which needs to be attached to the Scanner instance |
OPENCLARITY_AWS_KEYPAIR_NAME | | | Name of the SSH KeyPair to use for Scanner instance launch |
OPENCLARITY_AWS_SCANNER_INSTANCE_ARCHITECTURE | | x86_64 | Architecture to be used for Scanner instance. The Provider will use this value to lookup for instance details in OPENCLARITY_AWS_SCANNER_INSTANCE_ARCHITECTURE_TO_TYPE_MAPPING and OPENCLARITY_AWS_SCANNER_INSTANCE_ARCHITECTURE_TO_AMI_MAPPING. |
OPENCLARITY_AWS_SCANNER_INSTANCE_ARCHITECTURE_TO_TYPE_MAPPING | | x86_64:t3.large,arm64:t4g.large | Comma separated list of architecture:instance_type pairs used for OpenClarity Scanner instance |
OPENCLARITY_AWS_SCANNER_INSTANCE_ARCHITECTURE_TO_AMI_MAPPING | | x86_64:ami-03f1cc6c8b9c0b899,arm64:ami-06972d841707cc4cf | Comma separated list of architecture:ami_id pairs used for OpenClarity Scanner instance |
OPENCLARITY_AWS_BLOCK_DEVICE_NAME | | xvdh | Block device name used for attaching Scanner volume to the Scanner instance |
UI backend
| Environment Variable | Required | Default | Values | Description |
OPENCLARITY_UIBACKEND_APISERVER_ADDRESS | yes | | | The URL for the API Server used by the UI backend to interact with the API. Example: https://apiserver.example.com:8888/api |
OPENCLARITY_UIBACKEND_LISTEN_ADDRESS | | 0.0.0.0:8890 | | Address of the UI backend to send requests to. Example: localhost:8890 |
OPENCLARITY_UIBACKEND_HEALTHCHECK_ADDRESS | | 0.0.0.0:8083 | | Bind address to used by the UI backend for healthz endpoint. Example: localhost:8082 which will make the health endpoints be available at localhost:8083/healthz/live and localhost:8083/healthz/ready. |
7 -
Troubleshooting and debugging OpenClarity
Table of Contents
How to debug the Scanner VMs
Docker and Kubernetes provider
For Docker provider, scanners are created as containers, while as pods in case of Kubernetes. In both cases, you can
access them directly and check the logs.
Cloud providers
On cloud providers (AWS, Azure, GCP) OpenClarity is configured to create the Scanner VMs with the same key-pair that the
OpenClarity server has. The Scanner VMs run in a private network, however the OpenClarity Server can be used as a
bastion/jump host to reach them via SSH.
ssh -i <key-pair private key> -J ubuntu@<openclarity server public IP> ubuntu@<scanner VM private IP address>
Once SSH access has been established, the status of the VM’s start up
configuration can be debugged by checking the cloud-init logs:
sudo journalctl -u cloud-final
And the openclarity-scanner service logs:
sudo journalctl -u openclarity-scanner
8 - Archive
This section contains the documentation for VMClarity, KubeClarity, and APIClarity.
Announcement: OpenClarity Unification
We have reached the final step in the OpenClarity unification roadmap. Previously, we successfully enriched VMClarity with Kubernetes scanning and runtime features, achieving feature parity with KubeClarity.
We are currently in the process of unifying the two projects - KubeClarity and VMClarity - into one consolidated project under OpenClarity.
The VMClarity and KubeClarity repositories will not be maintained in the future. Thank you for your support and contributions as we continue to enhance and streamline the OpenClarity ecosystem.
8.1 - VM Security
VMClarity is an open source tool for agentless detection and management of Virtual Machine Software Bill Of Materials (SBOM) and security threats such as vulnerabilities, exploits, malware, rootkits, misconfigurations and leaked secrets.
VMClarity is the tool responsible for VM Security in the OpenClarity platform.
Join VMClarity’s Slack channel to hear about the latest announcements and upcoming activities. We would love to get your feedback!
Why VMClarity?
Virtual machines (VMs) are the most used service across all hyperscalers. AWS,
Azure, GCP, and others have virtual computing services that are used not only
as standalone VM services but also as the most popular method for hosting
containers (e.g., Docker, Kubernetes).
VMs are vulnerable to multiple threats:
- Software vulnerabilities
- Leaked Secrets/Passwords
- Malware
- System Misconfiguration
- Rootkits
There are many very good open source and commercial-based solutions for
providing threat detection for VMs, manifesting the different threat categories above.
However, there are challenges with assembling and managing these tools yourself:
- Complex installation, configuration, and reporting
- Integration with deployment automation
- Siloed reporting and visualization
The VMClarity project is focused on unifying detection and management of VM security threats in an agentless manner.
Overview
VMClarity uses a pluggable scanning infrastructure to provide:
- SBOM analysis
- Package and OS vulnerability detection
- Exploit detection
- Leaked secret detection
- Malware detection
- Misconfiguration detection
- Rootkit detection
The pluggable scanning infrastructure uses several tools that can be
enabled/disabled on an individual basis. VMClarity normalizes, merges and
provides a robust visualization of the results from these various tools.
These tools include:
- SBOM Generation and Analysis
- Vulnerability detection
- Exploits
- Secrets
- Malware
- Misconfiguration
- Rootkits
A high-level architecture overview is available in Architecture.
Roadmap
VMClarity project roadmap is available here.
8.1.1 - Architecture
Today, VMClarity has two halves, the VMClarity control plane, and the
VMClarity CLI.
The VMClarity control plane includes several microservices:
-
API Server: The VMClarity API for managing all objects in the VMClarity
system. This is the only component in the system which talks to the DB.
-
Orchestrator: Orchestrates and manages the life cycle of VMClarity
scan configs, scans and asset scans. Within the Orchestrator there is a
pluggable “provider” which connects the orchestrator to the environment to be
scanned and abstracts asset discovery, VM snapshotting as well as creation of
the scanner VMs. (Note The only supported provider today is AWS, other
hyperscalers are on the roadmap)
-
UI Backend: A separate backend API which offloads some processing from
the browser to the infrastructure to process and filter data closer to the
source.
-
UI Webserver: A server serving the UI static files.
-
DB: Stores the VMClarity objects from the API. Supported options are
SQLite and Postgres.
-
Scanner Helper services: These services provide support to the VMClarity
CLI to offload work that would need to be done in every scanner, for example
downloading the latest vulnerability or malware signatures from the various DB
sources. The components included today are:
- grype-server: A rest API wrapper around the grype vulnerability scanner
- trivy-server: Trivy vulnerability scanner server
- exploitDB server: A test API which wraps the Exploit DB CVE to exploit mapping logic
- freshclam-mirror: A mirror of the ClamAV malware signatures
The VMClarity CLI contains all the logic for performing a scan, from mounting
attached volumes and all the pluggable infrastructure for all the families, to
exporting the results to VMClarity API.
These components are containerized and can be deployed in a number of different
ways. For example our cloudformation installer deploys VMClarity on a VM using
docker in an dedicated AWS Virtual Private Cloud (VPC).
Once the VMClarity server instance has been deployed, and the scan
configurations have been created, VMClarity will discover VM resources within
the scan range defined by the scan configuration (e.g., by region, instance
tag, and security group). Once the asset list has been created, snapshots of
the assets are taken, and a new scanner VM are launched using the snapshots as
attached volumes. The VMClarity CLI running within the scanner VM will perform
the configured analysis on the mounted snapshot, and report the results to the
VMClarity API. These results are then processed by the VMClarity backend into
findings.

8.1.2 - Getting started
This chapter guides you through the installation of the VMClarity backend and the CLI, and shows you the most common tasks that you can perform with VMClarity.
8.1.2.1 - Deploy on AWS
An AWS CloudFormation template is provided for quick deployment of the VMClarity environment.
Note: To avoid extra costs (cross-region snapshots), you may want to deploy the VMClarity AWS CloudFormation template in the same region where the majority of the VMs are that you want to scan with VMClarity.
The following figure shows the basic AWS resources that the VMClarity CloudFormation template creates:
-
a VPC with a public and private subnet, and
-
an AWS Internet Gateway (IGW) and NAT Gateway (NGW) into the VPC.
The public subnet (VmClarityServerSubnet) hosts the VMClarity Server (VmClarityServer) EC2 instance. The VMClarity server houses the scanning configuration, the UI, and other control components. The EC2 instance is assigned an external IPv4 address (EIP) for SSH and web UI access.
The private subnet (VmClarityScannerSubnet) hosts the VM snapshot instances (EC2) that are scanned for security vulnerabilities.
Prerequisites
Deployment steps
To deploy the VMClarity AWS CloudFormation Stack, you can:
- click this quick-create link to navigate directly to the AWS CloudFormation console and jump to the wizard instructions, or
- complete the following steps.
-
Download the latest VMClarity release.
wget https://github.com/openclarity/vmclarity/releases/download/v1.1.2/aws-cloudformation-v1.1.2.tar.gz
Alternatively, copy the AWS CloudFormation template file from the project repository to deploy the latest development code and skip the next step.
-
Create a new directory and extract the files.
mkdir aws-cloudformation-v1.1.2
tar -xvzf aws-cloudformation-v1.1.2.tar.gz -C aws-cloudformation-v1.1.2
-
Log in to the AWS CloudFormation console and go to the AWS CloudFormation Stacks section, then select Create Stack > With New Resources (standard).
-
Check Template is ready and Upload a template file, then click Upload a template file/Choose file and upload the previously downloaded CFN template file.
-
In the VMClarity CloudFormation Stack wizard, set the following:
- Enter a name for the stack.
- Select the InstanceType (defaults to
t2.large for the VMClarity Server, and the scanner VMs). - Specify the SSH key for the EC2 instance in the KeyName field. You will need this key to connect to VMClarity.
- Adjust SSHLocation according to your policies.
- Do not change AdvancedConfiguration, unless you are building from a custom registry.
- Click NEXT.
- (Optional) Add tags as needed for your environment. You can use the defaults unless you need to adjust for your own policies.
- Click NEXT, then scroll to the bottom of the screen, and check I acknowledge….
- Click SUBMIT.
-
Once the stack is deployed successfully, copy the VMClarity SSH address from the Outputs tab.
-
Open an SSH tunnel to VMClarity the server
ssh -N -L 8080:localhost:80 -i "<Path to the SSH key specified during install>" ubuntu@<VmClarity SSH Address copied during install>
-
Open the VMClarity UI in your browser at http://localhost:8080/. The dashboard opens.

-
(Optional) If needed, you can access the API athttp://localhost:8080/api. For details on the API, see API Reference.
Next steps
Complete the First tasks on the UI.
8.1.2.2 - Deploy on Azure
Prerequisites
Deployment steps
-
Click here to deploy VMClarity’s custom template.
-
Fill out the required Project details and Instance details in the Basics tab.
You can set the following parameters:
| Parameter | Required | Description |
| Subscription | True | Azure subscription where resources will be billed. |
| Region | False | Azure region where resources will be deployed. |
| VMClarity Deploy Postfix | True | Postfix for Azure resource group name (e.g. vmclarity-<postfix>). |
| VMClarity Server SSH Username | True | SSH Username for the VMClarity Server Virtual Machine. |
| VMClarity Server SSH Public Key | True | SSH Public Key for the VMClarity Server Virtual Machine. Paste the contents of ~/.ssh/id_rsa2.pub here. |
| VMClarity Server VM Size | True | The size of the VMClarity Server Virtual Machine. |
| VMClarity Scanner VMs Size | True | The size of the VMClarity Scanner Virtual Machines. |
| Security Type | False | Security Type of the VMClarity Server Virtual Machine, e.g. TrustedLaunch (default) or Standard. |
-
(Optional) In the Advanced tab, modify the Container Image for each service if a specific VMClarity version is required. Then, select the delete policy and the database.
| Parameter | Required | Description |
| Service Container Image | True | Docker Container Image to use for each service. |
| Asset Scan Delete Policy | True | Delete Policy for resources created when performing an asset scan, e.g. Always, OnSuccess or Never. |
| Database To Use | True | Database type to use, e.g. SQLite, PostgreSQL or External PostgreSQL. |
-
Click Review + create to create the deployment.
-
Once the deployment is completed successfully, copy the VMClarity SSH address from the Outputs tab.
-
Open an SSH tunnel to VMClarity the server
ssh -N -L 8080:localhost:80 -i "<Path to the SSH key specified during install>" ubuntu@<VmClarity SSH Address copied during install>
-
Open the VMClarity UI in your browser at http://localhost:8080/. The dashboard opens.
-
(Optional) If needed, you can access the API athttp://localhost:8080/api. For details on the API, see API Reference.
Next steps
Complete the First tasks on the UI.
8.1.2.3 - Deploy on Docker
Prerequisites
Deployment steps
To run VMClarity in Docker on a local machine, complete the following steps.
-
Download the latest VMClarity release.
wget https://github.com/openclarity/vmclarity/releases/download/v1.1.2/docker-compose-v1.1.2.tar.gz
-
Create a new directory, extract the files and navigate to the directory.
mkdir docker-compose-v1.1.2
tar -xvzf docker-compose-v1.1.2.tar.gz -C docker-compose-v1.1.2
cd docker-compose-v1.1.2
-
Start every control plane element with the docker compose file.
docker compose --project-name vmclarity --file docker-compose.yml up -d --wait --remove-orphans
The output should be similar to:
[+] Running 14/14
⠿ Network vmclarity                        Created                                                       0.2s
⠿ Volume "vmclarity_grype-server-db"       Created                                                       0.0s
⠿ Volume "vmclarity_apiserver-db-data"     Created                                                       0.0s
⠿ Container vmclarity-orchestrator-1       Healthy                                                      69.7s
⠿ Container vmclarity-yara-rule-server-1   Healthy                                                      17.6s
⠿ Container vmclarity-exploit-db-server-1  Healthy                                                      17.7s
⠿ Container vmclarity-swagger-ui-1         Healthy                                                       7.8s
⠿ Container vmclarity-trivy-server-1       Healthy                                                      26.7s
⠿ Container vmclarity-uibackend-1          Healthy                                                      17.6s
⠿ Container vmclarity-ui-1                 Healthy                                                       7.7s
⠿ Container vmclarity-freshclam-mirror-1   Healthy                                                       7.8s
⠿ Container vmclarity-grype-server-1       Healthy                                                      37.3s
⠿ Container vmclarity-gateway-1            Healthy                                                       7.7s
⠿ Container vmclarity-apiserver-1          Healthy                                                      17.7s
Please note that the image_override.env file enables you to use the images you build yourself. You can override parameters in the docker-compose.yml by passing a custom env file to the docker compose up command via the --env-file flag. The /installation/docker/image_override.env file contains an example overriding all the container images.
-
Check the running containers in the Docker desktop.
-
Access the VMClarity UI. Navigate to http://localhost:8080/ in your browser.
Next steps
Complete the First tasks on the UI.
Clean up steps
-
After you’ve finished your tasks, stop the running containers.
docker compose --project-name vmclarity --file docker-compose.yml down --remove-orphans
8.1.2.4 - Deploy on GCP
Prerequisites
- You can install VMClarity using the CLI, so you have to have gcloud on your
computer available beforehand. For details on installing and configuring gcloud, see the official installation guide.
- If you have already installed VMClarity before and want to reinstall it, you have to manually restore deleted roles that were created during the previous installation.
Deployment steps
To install VMClarity on Google Cloud Platform (GCP), complete the following steps.
-
Download the newest GCP deployment release from GitHub and extract it to any location.
wget https://github.com/openclarity/vmclarity/releases/download/v1.1.2/gcp-deployment-v1.1.2.tar.gz
-
Create a new directory, extract the files and navigate to the directory.
mkdir gcp-deployment-v1.1.2
tar -xvzf gcp-deployment-v1.1.2.tar.gz -C gcp-deployment-v1.1.2
cd gcp-deployment-v1.1.2
-
Copy the example configuration file and rename it.
cp vmclarity-config.example.yaml vmclarity-config.yaml
-
The following table contains all the fields that can be set in the vmclarity-config.yaml file. You have to set at
least the required ones.
| Field | Required | Default | Description |
zone | yes | | The Zone to locate the VMClarity server. |
machineType | yes | | The machine type for the VMClarity server. |
region | yes | | The region to locate VMClarity. |
scannerMachineType | | e2-standard-2 | Machine type to use for the Scanner instances. |
scannerSourceImage | | projects/ubuntu-os-cloud/global/images/ubuntu-2204-jammy-v20230630 | Source image to use for the Scanner instances. |
databaseToUse | | SQLite | The database that VMClarity should use. |
apiserverContainerImage | | ghcr.io/openclarity/vmclarity-apiserver:1.1.2 | The container image to use for the apiserver. |
orchestratorContainerImage | | ghcr.io/openclarity/vmclarity-orchestrator:1.1.2 | The container image to use for the orchestrator. |
uiContainerImage | | ghcr.io/openclarity/vmclarity-ui:1.1.2 | The container image to use for the ui. |
uibackendContainerImage | | ghcr.io/openclarity/vmclarity-ui-backend:1.1.2 | The container image to use for the uibackend. |
scannerContainerImage | | ghcr.io/openclarity/vmclarity-cli:1.1.2 | The container image to use for the scanner. |
exploitDBServerContainerImage | | ghcr.io/openclarity/exploit-db-server:v0.2.4 | The container image to use for the exploit db server. |
trivyServerContainerImage | | docker.io/aquasec/trivy:0.41.0 | The container image to use for the trivy server. |
grypeServerContainerImage | | ghcr.io/openclarity/grype-server:v0.7.0 | The container image to use for the grype server. |
freshclamMirrorContainerImage | | ghcr.io/openclarity/freshclam-mirror:v0.2.0 | The container image to use for the fresh clam mirror server. |
postgresqlContainerImage | | docker.io/bitnami/postgresql:12.14.0-debian-11-r28 | The container image to use for the postgresql server. |
assetScanDeletePolicy | | Always | When asset scans should be cleaned up after scanning. |
postgresDBPassword | | | Postgres DB password. Only required if DatabaseToUse is Postgresql. |
externalDBName | | | DB to use in the external DB. Only required if DatabaseToUse is External. |
externalDBUsername | | | Username for the external DB. Only required if the DatabaseToUse is External. |
externalDBPassword | | | Password for the external DB. Only required if the DatabaseToUse is External. |
externalDBHost | | | Hostname or IP for the external DB. Only required if the DatabaseToUse is External. |
externalDBPort | | | Port for the external DB. Only required if the DatabaseToUse is External. |
-
Deploy VMClarity using gcloud deployment-manager.
gcloud deployment-manager deployments create <vmclarity deployment name> --config vmclarity-config.yaml
-
Open an SSH tunnel to the VMClarity server with gcloud. For further information on how to create an SSH connection
with gcloud to one of your instances check the official page.
gcloud compute ssh --project=<project id> --zone=<zone name> <name of your VM> -- -NL 8080:localhost:80
-
Open the VMClarity UI in your browser at http://localhost:8080/. The dashboard opens.
-
(Optional) If needed, you can access the API athttp://localhost:8080/api. For details on the API, see API Reference.
Next steps
Complete the First tasks on the UI.
Uninstall VMClarity
-
You can uninstall VMClarity using the gcloud manager.
gcloud deployment-manager deployments delete <vmclarity deployment name>
Restore deleted roles
-
On the IAM & Admin page on GCP, open the Roles tab, then search for VMClarity in the filter input.
-
Now manually undelete the Discoverer Snapshotter and Scanner roles to set their statuses from Deleted to Enabled.
8.1.2.5 - Deploy on Kubernetes
Prerequisites
- Install a tool to run local Kubernetes clusters. Here, Kind is used as the default option for creating a local cluster.
- Helm to install VMClarity.
Deployment steps
To deploy VMClarity to your Kubernetes cluster, complete the following steps.
-
Create a Kubernetes cluster.
kind create cluster --name vmclarity-k8s
-
Ensure the Kubernetes cluster is up and running. If you’re using kind, you can check the status of your clusters with the following command:
-
Use Helm to install VMClarity. Run the following command:
helm install vmclarity oci://ghcr.io/openclarity/charts/vmclarity --version 1.1.2 \
    --namespace vmclarity --create-namespace \
    --set orchestrator.provider=kubernetes \
    --set orchestrator.serviceAccount.automountServiceAccountToken=true
-
Verify that all the VMClarity pods have been successfully deployed by executing the following command:
kubectl get pods -n vmclarity
-
Wait until all pods are in the Running state or have completed their initialization.
-
Once the pods are ready, start port forwarding to access the VMClarity gateway service. Use the following command to forward traffic from your local machine to the cluster:
kubectl port-forward -n vmclarity service/vmclarity-gateway 8080:80
-
Access the VMClarity UI by navigating to http://localhost:8080/ in your web browser.
Next steps
Complete the First tasks on the UI.
Clean up steps
-
Uninstall VMClarity with Helm. Run the following command:
helm uninstall vmclarity --namespace vmclarity
-
Delete the Kubernetes cluster.
kind delete clusters vmclarity-k8s
8.1.2.6 - First tasks on the UI
-
Open the VMClarity UI in your browser at http://localhost:8080/. The dashboard opens.
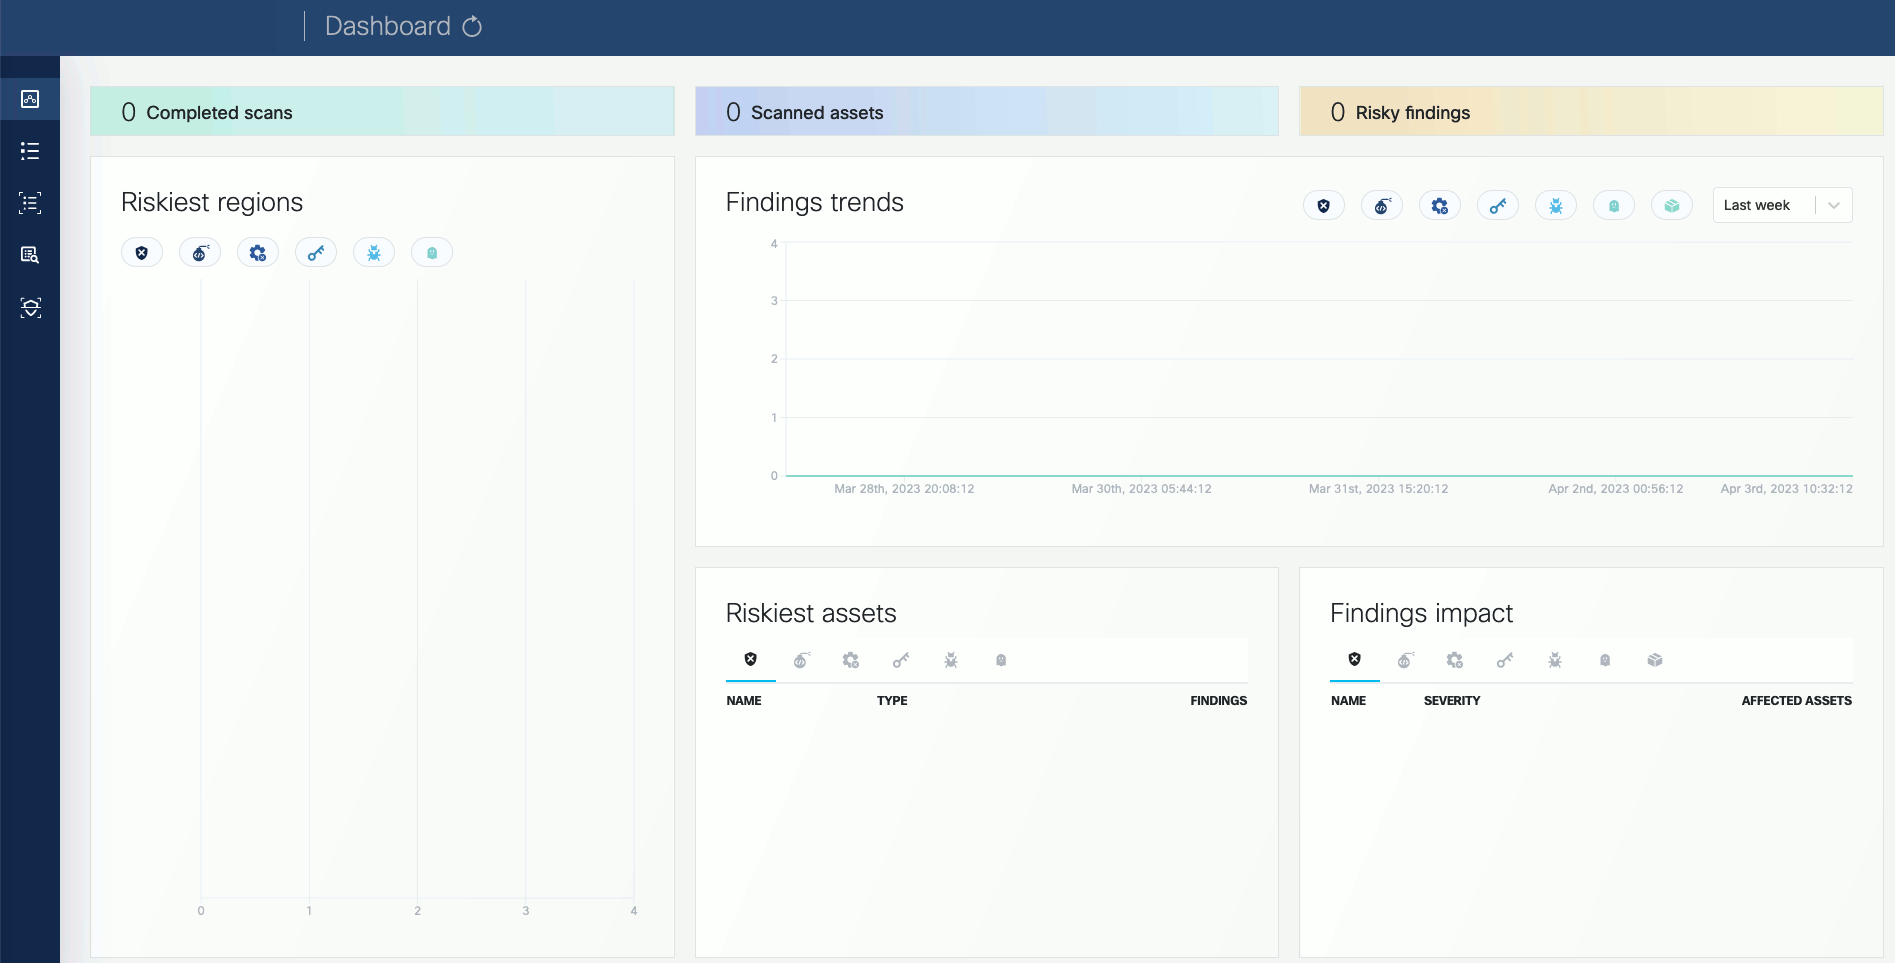
-
(Optional) If needed, you can access the API athttp://localhost:8080/api. For details on the API, see API Reference.
-
Click on the Scans icon. In the Scans window, you can create a new scan configuration.

-
Click New scan configuration.

-
Follow the steps of the New scan config wizard to name the scan, and identify the AWS scope (region, VPC, security groups, etc). The following example shows the AWS us-east-2 region, a specific VPC, and the vmclarity-demo-vm EC2

-
Enable the scan types you want to perform.

-
Select the time and/or frequency of the scans. To run the scan immediately, select Now.

-
Click Save. The new scan appears on the Scan Configurations tab.

-
Once a scan is finished, you can browse around the various VMClarity UI features and investigate the security scan reports.


8.1.3 - Common CLI tasks
Initiate a scan using the CLI
Reporting results into file:
./cli/bin/vmclarity-cli scan --config ~/testConf.yaml -o outputfile
If we want to report results to the VMClarity backend, we need to create asset and asset scan object before scan because it requires asset-scan-id
Reporting results to VMClarity backend:
ASSET_ID=$(./cli/bin/vmclarity-cli asset-create --file assets/dir-asset.json --server http://localhost:8080/api) --jsonpath {.id}
ASSET_SCAN_ID=$(./cli/bin/vmclarity-cli asset-scan-create --asset-id $ASSET_ID --server http://localhost:8080/api) --jsonpath {.id}
./cli/bin/vmclarity-cli scan --config ~/testConf.yaml --server http://localhost:8080/api --asset-scan-id $ASSET_SCAN_ID
Using one-liner:
./cli/bin/vmclarity-cli asset-create --file docs/assets/dir-asset.json --server http://localhost:8080/api --update-if-exists --jsonpath {.id} | xargs -I{} ./cli/bin/vmclarity-cli asset-scan-create --asset-id {} --server http://localhost:8080/api --jsonpath {.id} | xargs -I{} ./cli/bin/vmclarity-cli scan --config ~/testConf.yaml --server http://localhost:8080/api --asset-scan-id {}
8.1.4 - Configuration Parameters
Orchestrator
| Environment Variable | Required | Default | Values | Description |
VMCLARITY_ORCHESTRATOR_PROVIDER | yes | aws | aws, azure, gcp, docker | Provider used for Asset discovery and scans. |
VMCLARITY_ORCHESTRATOR_APISERVER_ADDRESS | yes | | | The URL for the API Server used by the Orchestrator to interact with the API. Example: https://apiserver.example.com:8888/api |
VMCLARITY_ORCHESTRATOR_HEALTHCHECK_ADDRESS | | :8082 | | Bind address to used by the Orchestrator for healthz endpoint. Example: localhost:8082 which will make the health endpoints be available at localhost:8082/healthz/live and localhost:8082/healthz/ready. |
VMCLARITY_ORCHESTRATOR_DISCOVERY_INTERVAL | | 2m | | How frequently the Discovery perform discovery of Assets. |
VMCLARITY_ORCHESTRATOR_CONTROLLER_STARTUP_DELAY | | 7s | | The time interval to wait between cotroller startups. Do NOT change this parameter unless you know what you are doing. |
VMCLARITY_ORCHESTRATOR_ASSETSCAN_WATCHER_POLL_PERIOD | | 15s | | How frequently poll the API for events related AssetScan objects. |
VMCLARITY_ORCHESTRATOR_ASSETSCAN_WATCHER_RECONCILE_TIMEOUT | | 5m | | Time period for reconciling a AssetScan event is allowed to run. |
VMCLARITY_ORCHESTRATOR_ASSETSCAN_WATCHER_ABORT_TIMEOUT | | 10m | | Time period to wait for the Scanner to gracefully stop on-going scan for AssetScan before setting the state of the AssetScan to Failed. |
VMCLARITY_ORCHESTRATOR_ASSETSCAN_WATCHER_DELETE_POLICY | | Always | Always, Never, OnSuccess | Whether to delete resources (disk snapshot, container snapshot/images) or not based on the status of the AssetScan. Always means the AssetScan is deleted no matter if it failed or not. Never skip cleaning up the resources created for scanning. OnSuccess means that cleanup is happening only iun case the AssetScan was successful. |
VMCLARITY_ORCHESTRATOR_ASSETSCAN_WATCHER_SCANNER_CONTAINER_IMAGE | yes | | | The Scanner container image used for running scans. |
VMCLARITY_ORCHESTRATOR_ASSETSCAN_WATCHER_SCANNER_FRESHCLAM_MIRROR | | | | |
VMCLARITY_ORCHESTRATOR_ASSETSCAN_WATCHER_SCANNER_APISERVER_ADDRESS | | | | The URL for the API Server used by the Scanner to interact with the API. Example: https://apiserver.example.com:8888/api |
VMCLARITY_ORCHESTRATOR_ASSETSCAN_WATCHER_SCANNER_EXPLOITSDB_ADDRESS | | | | The URL for the ExploitsDB Server used by the Scanner. |
VMCLARITY_ORCHESTRATOR_ASSETSCAN_WATCHER_SCANNER_TRIVY_SERVER_ADDRESS | | | | The URL for the Trivy Server used by the Scanner. |
VMCLARITY_ORCHESTRATOR_ASSETSCAN_WATCHER_SCANNER_TRIVY_SERVER_TIMEOUT | | 5m | | |
VMCLARITY_ORCHESTRATOR_ASSETSCAN_WATCHER_SCANNER_GRYPE_SERVER_ADDRESS | | | | The URL for the Grype Server used by the Scanner. |
VMCLARITY_ORCHESTRATOR_ASSETSCAN_WATCHER_SCANNER_GRYPE_SERVER_TIMEOUT | | 2m | | |
VMCLARITY_ORCHESTRATOR_ASSETSCAN_WATCHER_SCANNER_YARA_RULE_SERVER_ADDRESS | | | | The URL for the Yara Rule Server used by the Scanner. |
VMCLARITY_ORCHESTRATOR_SCANCONFIG_WATCHER_POLL_PERIOD | | | | How frequently the ScanConfig Watcher poll the API for events related ScanConfig objects. |
VMCLARITY_ORCHESTRATOR_SCANCONFIG_WATCHER_RECONCILE_TIMEOUT | | | | Time period which a reconciliation for a ScanConfig event is allowed to run. |
VMCLARITY_ORCHESTRATOR_SCAN_WATCHER_POLL_PERIOD | | | | How frequently the AssetScan Watcher poll the API for events related Scan objects. |
VMCLARITY_ORCHESTRATOR_SCAN_WATCHER_RECONCILE_TIMEOUT | | | | Time period for reconciling a Scan event is allowed to run. |
VMCLARITY_ORCHESTRATOR_SCAN_WATCHER_SCAN_TIMEOUT | | | | Time period to wait for the Scan finish before marked it’s state as Failed with Timeout as a reason. |
VMCLARITY_ORCHESTRATOR_ASSETSCAN_PROCESSOR_POLL_PERIOD | | | | How frequently the AssetScan Processor poll the API for events related AssetScan objects. |
VMCLARITY_ORCHESTRATOR_ASSETSCAN_PROCESSOR_RECONCILE_TIMEOUT | | | | Time period for processing for a AssetScan result is allowed to run. |
VMCLARITY_ORCHESTRATOR_ASSETSCAN_ESTIMATION_WATCHER_POLL_PERIOD | | 5s | | |
VMCLARITY_ORCHESTRATOR_ASSETSCAN_ESTIMATION_WATCHER_RECONCILE_TIMEOUT | | 15s | | |
VMCLARITY_ORCHESTRATOR_SCAN_ESTIMATION_WATCHER_POLL_PERIOD | | 5s | | |
VMCLARITY_ORCHESTRATOR_SCAN_ESTIMATION_WATCHER_RECONCILE_TIMEOUT | | 2m | | |
VMCLARITY_ORCHESTRATOR_SCAN_ESTIMATION_WATCHER_ESTIMATION_TIMEOUT | | 48h | | |
Provider
AWS
| Environment Variable | Required | Default | Description |
VMCLARITY_AWS_REGION | yes | | Region where the Scanner instance needs to be created |
VMCLARITY_AWS_SUBNET_ID | yes | | SubnetID where the Scanner instance needs to be created |
VMCLARITY_AWS_SECURITY_GROUP_ID | yes | | SecurityGroupId which needs to be attached to the Scanner instance |
VMCLARITY_AWS_KEYPAIR_NAME | | | Name of the SSH KeyPair to use for Scanner instance launch |
VMCLARITY_AWS_SCANNER_AMI_ID | yes | | The AMI image used for creating Scanner instance |
VMCLARITY_AWS_SCANNER_INSTANCE_TYPE | | t2.large | The instance type used for Scanner instance |
VMCLARITY_AWS_BLOCK_DEVICE_NAME | | xvdh | Block device name used for attaching Scanner volume to the Scanner instance |
8.1.5 - Troubleshooting and Debugging
How to debug the Scanner VMs
How to debug the Scanner VMs can differ per provider these are documented
below.
Debug Scanner VM on AWS
On AWS VMClarity is configured to create the Scanner VMs with the same key-pair
that the VMClarity server has. The Scanner VMs run in a private network,
however the VMClarity Server can be used as a bastion/jump host to reach them
via SSH.
ssh -i <key-pair private key> -J ubuntu@<vmclarity server public IP> ubuntu@<scanner VM private IP address>
Once SSH access has been established, the status of the VM’s start up
configuration can be debugged by checking the cloud-init logs:
sudo journalctl -u cloud-final
And the vmclarity-scanner service logs:
sudo journalctl -u vmclarity-scanner
8.1.6 - VMClarity development
Building VMClarity Binaries
Makefile targets are provided to compile and build the VMClarity binaries.
make build can be used to build all of the components, but also specific
targets are provided, for example make build-cli and make build-backend to
build the specific components in isolation.
Building VMClarity Containers
make docker can be used to build the VMClarity containers for all of the
components. Specific targets for example make docker-cli and make docker-backend are also provided.
make push-docker is also provided as a shortcut for building and then
publishing the VMClarity containers to a registry. You can override the
destination registry like:
DOCKER_REGISTRY=docker.io/tehsmash make push-docker
You must be logged into the docker registry locally before using this target.
Linting
make lint can be used to run the required linting rules over the code.
golangci-lint rules and config can be viewed in the .golangcilint file in the
root of the repo.
make fix is also provided which will resolve lint issues which are
automatically fixable for example format issues.
make license can be used to validate that all the files in the repo have the
correctly formatted license header.
To lint the cloudformation template, cfn-lint can be used, see
https://github.com/aws-cloudformation/cfn-lint#install for instructions on how
to install it for your system.
Unit tests
make test can be used run all the unit tests in the repo. Alternatively you
can use the standard go test CLI to run a specific package or test like:
go test ./cli/cmd/... -run Test_isSupportedFS
Generating API code
After making changes to the API schema in api/openapi.yaml, you can run make api to regenerate the model, client and server code.
Testing End to End
For details on how to test VMClarity end to end please see End-to-End Testing Guide.
8.1.6.1 - End-to-End Testing Guide
Installing a specific VMClarity build on AWS
-
Build the containers and publish them to your docker registry
DOCKER_REGISTRY=<your docker registry> make push-docker
-
Install VMClarity cloudformation
- Ensure you have an SSH key pair uploaded to AWS Ec2
- Go to CloudFormation -> Create Stack -> Upload template.
- Upload the
VMClarity.cfn file. - Follow the wizard through to the end
- Set the
VMClarity Backend Container Image and VMClarity Scanner Container Image parameters in the wizard to use custom images (from step 1.) for deployment. - Change the Asset Scan Delete Policy to
OnSuccess or Never if debugging scanner VMs is required.
- Wait for install to complete
-
Ensure that VMClarity backend is working correctly
-
Get the IP address from the CloudFormation stack’s Output Tab
-
ssh ubuntu@<ip address>
-
Check the VMClarity Logs
sudo journalctl -u vmclarity
-
Copy the example scanConfig.json into the ubuntu user’s home directory
scp scanConfig.json ubuntu@<ip address>:~/scanConfig.json
-
Edit the scanConfig.json
-
Give the scan config a unique name
-
Enable the different scan families you want:
"scanFamiliesConfig": {
  "sbom": {
    "enabled": true
  },
  "vulnerabilities": {
    "enabled": true
  },
  "exploits": {
    "enabled": true
  }
},
-
Configure the scope of the test
-
All:
```yaml
"scope": ""
```
- Set operationTime to the time you want the scan to run. As long as the time is in the future it can be within seconds.
-
While ssh’d into the VMClarity server run
curl -X POST http://localhost:8080/api/scanConfigs -H 'Content-Type: application/json' -d @scanConfig.json
-
Check VMClarity logs to ensure that everything is performing as expected
sudo journalctl -u vmclarity
-
Monitor the asset scans
-
Get scans:
curl -X GET http://localhost:8080/api/scans
After the operationTime in the scan config created above there should be a new
scan object created in Pending.
Once discovery has been performed, the scan’s assetIDs list should be
populated will all the assets to be scanned by this scan.
The scan will then create all the “assetScans” for tracking the scan
process for each asset. When that is completed the scan will move to
“InProgress”.
-
Get asset scans:
curl -X GET http://localhost:8080/api/assetScans
8.1.8 - Cost estimation
Available in version 0.6.0 and later. Currently, this feature is exclusively available on AWS.
You can get a preliminary cost estimation before initiating a security scan with VMClarity. This helps you plan and budget your security assessments more effectively, ensuring that you have a clear understanding of the financial implications before taking action.
To start a new estimation, complete the following steps.
-
Create a new resource called ScanEstimation in the API server. For example, if your POST’s body is the following JSON, it will estimate an SBOM scan on your workload with id i-123456789.
Use the same same scanTemplate in the ScanEstimation than in the ScanConfiguration.
{
  "assetIDs": ["i-123456789"],
  "state": {
    "state": "Pending"
  },
  "scanTemplate": {
    "scope": "contains(assetInfo.tags, '{\"key\":\"scanestimation\",\"value\":\"test\"}')",
    "assetScanTemplate": {
      "scanFamiliesConfig": {
        "sbom": {
          "enabled": true
        }
      }
    }
  }
}
-
Retrieve the object from the <apiserver IP address>:8888/scanEstimations endpoint, and wait for the state to be Done. The totalScanCost of the summary property shows your scan’s cost in USD:
{
   "assetIDs":[
      "d337bd07-b67f-4cf0-ac43-f147fce7d1b2"
   ],
   "assetScanEstimations":[
      {
         "id":"23082244-0fb6-4aca-8a9b-02417dfc95f8"
      }
   ],
   "deleteAfter":"2023-10-08T17:33:52.512829081Z",
   "endTime":"2023-10-08T15:33:52.512829081Z",
   "id":"962e3a10-05fb-4c5d-a773-1198231f3103",
   "revision":5,
   "scanTemplate":{
      "assetScanTemplate":{
         "scanFamiliesConfig":{
            "sbom":{
               "enabled":true
            }
         }
      },
      "scope":"contains(assetInfo.tags, '{\"key\":\"scanestimation\",\"value\":\"test\"}')"
   },
   "startTime":"2023-10-08T15:33:37.513073573Z",
   "state":{
      "state":"Done",
      "stateMessage":"1 succeeded, 0 failed out of 1 total asset scan estimations",
      "stateReason":"Success"
   },
   "summary":{
      "jobsCompleted":1,
      "jobsLeftToRun":0,
      "totalScanCost":0.0006148403,
      "totalScanSize":3,
      "totalScanTime":12
   },
   "ttlSecondsAfterFinished":7200
}
8.2 - Kubernetes Security
KubeClarity is a tool for detection and management of Software Bill Of Materials (SBOM) and vulnerabilities of container images and filesystems. It scans both runtime K8s clusters and CI/CD pipelines for enhanced software supply chain security.
KubeClarity is the tool responsible for Kubernetes Security in the OpenClarity platform.

Why?
SBOM & Vulnerability Detection Challenges
- Effective vulnerability scanning requires an accurate Software Bill Of Materials (SBOM) detection:
- Various programming languages and package managers
- Various OS distributions
- Package dependency information is usually stripped upon build
- Which one is the best scanner/SBOM analyzer?
- What should we scan: Git repos, builds, container images or runtime?
- Each scanner/analyzer has its own format - how to compare the results?
- How to manage the discovered SBOM and vulnerabilities?
- How are my applications affected by a newly discovered vulnerability?
Solution
- Separate vulnerability scanning into 2 phases:
- Content analysis to generate SBOM
- Scan the SBOM for vulnerabilities
- Create a pluggable infrastructure to:
- Run several content analyzers in parallel
- Run several vulnerability scanners in parallel
- Scan and merge results between different CI stages using KubeClarity CLI
- Runtime K8s scan to detect vulnerabilities discovered post-deployment
- Group scanned resources (images/directories) under defined applications to navigate the object tree dependencies (applications, resources, packages, vulnerabilities)
Architecture

Limitations
- Supports Docker Image Manifest V2, Schema 2 (https://docs.docker.com/registry/spec/manifest-v2-2/). It will fail to scan earlier versions.
Roadmap
- Integration with additional content analyzers (SBOM generators)
- Integration with additional vulnerability scanners
- CIS Docker benchmark in UI
- Image signing using Cosign
- CI/CD metadata signing and attestation using Cosign and in-toto (supply chain security)
- System settings and user management
8.2.1 - Features
- Dashboard
- Fixable vulnerabilities per severity
- Top 5 vulnerable elements (applications, resources, packages)
- New vulnerabilities trends
- Package count per license type
- Package count per programming language
- General counters
- Applications
- Automatic application detection in K8s runtime
- Create/edit/delete applications
- Per application, navigation to related:
- Resources (images/directories)
- Packages
- Vulnerabilities
- Licenses in use by the resources
- Application Resources (images/directories)
- Per resource, navigation to related:
- Applications
- Packages
- Vulnerabilities
- Packages
- Per package, navigation to related:
- Applications
- Linkable list of resources and the detecting SBOM analyzers
- Vulnerabilities
- Vulnerabilities
- Per vulnerability, navigation to related:
- Applications
- Resources
- List of detecting scanners
- K8s Runtime scan
- On-demand or scheduled scanning
- Automatic detection of target namespaces
- Scan progress and result navigation per affected element (applications, resources, packages, vulnerabilities)
- CIS Docker benchmark
- CLI (CI/CD)
- SBOM generation using multiple integrated content analyzers (Syft, cyclonedx-gomod)
- SBOM/image/directory vulnerability scanning using multiple integrated scanners (Grype, Dependency-track)
- Merging of SBOM and vulnerabilities across different CI/CD stages
- Export results to KubeClarity backend
- API
Integrated SBOM generators and vulnerability scanners
KubeClarity content analyzer integrates with the following SBOM generators:
KubeClarity vulnerability scanner integrates with the following scanners:
8.2.2 - Concepts and background
The following sections give you the concepts and background information about the scans provided by KubeClarity.
8.2.2.1 - Software bill of materials
A software bill of materials (SBOM) is a list of all the components, libraries, and other dependencies that make up a software application, along with information about the versions, licenses, and vulnerabilities associated with each component. They are formal, structured documents detailing the components of a software product and its supply chain relationships.
SBOMs are important because organizations increasingly rely on open source and third-party software components to build and maintain their applications. These components can introduce security vulnerabilities and must be adequately managed and updated. SBOMs help you understand what open source and third-party components are used in your applications, and identify and address any security vulnerabilities.
Under specific scenarios, generating and publishing SBOMs is mandatory for compliance with regulations and industry standards that require organizations to disclose the use of open source and third-party software in their products.
SBOM standards
There are several related standards, for example, CycloneDX, SPDX, SWID.
SPDX (Software Package Data Exchange) is a standard format for communicating a software package’s components, licenses, and copyrights. It is commonly used to document the open source components included in a proprietary software product. SPDX files can be easily read and understood by humans and machines, making it easy to track and manage open source components in a software project. SPDX format is supported by Linux Foundation.
CycloneDX is an open source standard for creating software bill of materials files. It is like SPDX in that it documents the components and licenses associated with a software package, but it is specifically designed for use in software supply chain security. CycloneDX is a more lightweight format compared to SPDX, which is intended to be more detailed. CycloneDX format is supported by OWASP.
SBOM architecture
A typical SBOM architecture can be laid out as a tree-like dependency graph with the following key elements:
- Component inventory: Information about the components, libraries, and other assets used in the software, including version numbers, licenses, and vulnerabilities.
- Dependency mapping: A map of relationships between different components and libraries, showing how they depend on each other and how changes to one may impact the other.
- License management: It should also include information about the licenses of the components and libraries used to ensure that the software complies with legal and ethical obligations.
SBOM generators
There are two typical ways to generate SBOM: during the build process, or after the build and deployment using a Software Composition Analysis tool. Trivy and Syft are two noteworthy open source generators among many other generators, including open source and commercial. Both use CycloneDX format. It is also important to note that not all SBOMs can be generated equally. Each generator may pick up a few language libraries better than the others based on its implementation. It might take multiple runs through a few different types of generators to draw comprehensive insights.
KubeClarity content analyzer integrates with the following SBOM generators:
Multiple SBOMs for accuracy
KubeClarity can run multiple SBOM generators in parallel, and unify their results to generate a more accurate document.
In such cases, KubeClarity compiles a merged SBOM from multiple open source analyzers, and delivers a comprehensive SBOM document report. Although KubeClarity does not generate SBOMs, it integrates with popular generators so that a combined document can provide amplified inputs that can be further analyzed using vulnerability scanners. Leveraging multiple SBOM documents can improve visibility into software dependency posture.
KubeClarity formats the merged SBOM to comply with the input requirements of vulnerability scanners before starting vulnerability scans.
Note: KubeClarity can merge vulnerability scans from various sources like Grype and Trivy to generate a robust vulnerability scan report.
Scan SBOM documents for vulnerabilities
You can feed the generated SBOM documents to vulnerability scanners, which analyze the SBOMs and generate a vulnerability report detailing all known and fixed CVEs of the software components listed by SBOM.
Generate SBOM
For details on generating SBOMs with KubeClarity, see the Getting started and Generate SBOM.
8.2.2.2 - Kubernetes cluster runtime scan
Scanning your runtime Kubernetes clusters is essential to proactively detect and address vulnerabilities in real-time, ensuring the security and integrity of your applications and infrastructure. By continuously monitoring and scanning your clusters, you can mitigate risks, prevent potential attacks, and maintain a strong security posture in the dynamic Kubernetes environment.
Runtime scan features
KubeClarity enhance the runtime scanning experience:
Faster runtime scan
KubeClarity optimizes the scanning process, reducing the time required to detect vulnerabilities. This allows for quicker identification and remediation of potential security risks.
Reduce image TAR pulling
KubeClarity uses an efficient approach that avoids the unnecessary overhead of fetching the complete image tar.
Cache SBOMs
If an image has already been scanned, KubeClarity uses the cached SBOM data, avoiding time-consuming image retrieval and recomputing, improving overall efficiency.
Runtime scan architecture
The following figure illustrates the structure of a runtime scanning architecture. This layout visually represents the components and their interconnections within the runtime scanning system.

For details on performing runtime scans with KubeClarity, see the Getting started and Runtime scan.
8.2.2.3 - Vulnerability scanning
Vulnerability scanning identifies weak spots in software code and dependencies. Vulnerability scanners can identify infrastructure, networks, applications, or website vulnerabilities. These tools scan various target systems for security flaws that attackers could exploit.
The scanners use the information contained in the SBOM to identify vulnerabilities and potential security risks within software applications. Vulnerability scanners use SBOM information to:
- Identify vulnerable components: Scanners use the SBOM to identify a software application’s components, then cross-reference this information with known vulnerabilities and security issues to identify vulnerable components within the software.
- Prioritize vulnerabilities: After the vulnerability scanner has identified all vulnerable components within the software application, it uses the SBOM to prioritize the vulnerabilities so you can focus on the most critical vulnerabilities.
- Identify supply chain risks: SBOMs provide visibility into the software supply chain, enabling vulnerability scanners to identify third-party or security risks. As a result, organizations can mitigate supply chain risks and reduce their overall security exposure.
- Track changes and updates: Software vulnerability scanners use SBOM information to determine whether software changes have introduced new vulnerabilities or security risks.
The SBOM is a critical tool for vulnerability scanners, providing the information needed to identify, prioritize, and mitigate security risks within software applications. In addition, scanners also rely on other types of inputs, as listed below.
KubeClarity and vulnerability scanning
KubeClarity isn’t a vulnerability scanner but integrates with top opensource vulnerability scanners. It also helps with prioritization and risk management by visualization and filtering. It is often necessary to prioritize CVEs because of the sheer volume of identified CVEs. With KubeClarity’s vulnerability trending dashboard and APIs, you can locate and double-click into a specific CVE in your application or infrastructure.
KubeClarity features a range of flexible and dynamic filters that help map CVEs down to an application->package->Image level. Additionally, it normalizes reports from multiple scanners and calculates missing CVSS (Common Vulnerability Scoring System) scores.
KubeClarity vulnerability scanner integrates with the following scanners:
KubeClarity supports both automatic scans to find common vulnerabilities quickly and efficiently, and manual scans to help verify automated scans, and also to help identify more complex and less common vulnerabilities. In addition to conventional scans, KubeClarity also provides multi-scanner integration.
Multi-scanner architecture
KubeClarity infrastructure enables multiple scanners’ configuration and simultaneous operation. Scanners in KubeClarity are designed to work in parallel.
The following figure shows the multi-scanner architecture for vulnerability scanning: KubeClarity preprocesses the SBOMs so they conform to the specific formatting requirements of the specific scanner. Each scanner may have different types and unique formatting expectations. The scanners analyze the incoming data and generate vulnerability outputs in their native formats.
KubeClarity can merge the vulnerability reports of different scanners, to include severity levels, sources, and available fixes. These reports serve as valuable outputs, allowing you to filter and focus on specific areas of vulnerabilities for further investigation and resolution.
Run vulnerability scans
For details on running vulnerability scans with KubeClarity, see the Getting started and Vulnerability scan.
8.2.3 - Getting started
This chapter guides you through the installation of the KubeClarity backend and the CLI, and shows you the most common tasks that you can perform with KubeClarity.
8.2.3.1 - Install the KubeClarity backend
You can install the KubeClarity backend using Helm, or you can build and run it locally.
Prerequisites
KubeClarity requires these Kubernetes permissions:
| Permission | Reason |
| Read secrets in CREDS_SECRET_NAMESPACE (default: kubeclarity) | This allows you to configure image pull secrets for scanning private image repositories. |
| Read config maps in the KubeClarity deployment namespace. | This is required for getting the configured template of the scanner job. |
| List pods in cluster scope. | This is required for calculating the target pods that need to be scanned. |
| List namespaces. | This is required for fetching the target namespaces to scan in K8s runtime scan UI. |
| Create and delete jobs in cluster scope. | This is required for managing the jobs that scan the target pods in their namespaces. |
Prerequisites for AWS
If you are installing KubeClarity on AWS, complete the following steps. These are needed because KubeClarity uses a persistent PostgreSQL database, and that requires a volume.
- Make sure that your EKS cluster is 1.23 or higher.
- Install the EBS CSI Driver EKS add-on. For details, see Amazon EKS add-ons.
- Configure the EBS CSI Driver with IAMServiceRole and policies. For details, see Creating the Amazon EBS CSI driver IAM role.
Install using Helm
-
Add the Helm repository.
helm repo add kubeclarity https://openclarity.github.io/kubeclarity
-
Save the default KubeClarity chart values.
helm show values kubeclarity/kubeclarity > values.yaml
-
(Optional) Check the configuration in the values.yaml file and update the required values if needed. You can skip this step to use the default configuration.
- To enable and configure the supported SBOM generators and vulnerability scanners, check the
analyzer and scanner configurations under the vulnerability-scanner section. You can skip this step to use the default configuration settings.
-
Deploy KubeClarity with Helm.
-
If you have customized the values.yaml file, run:
helm install --values values.yaml --create-namespace kubeclarity kubeclarity/kubeclarity --namespace kubeclarity
-
To use the default configuration, run:
helm install --create-namespace kubeclarity kubeclarity/kubeclarity --namespace kubeclarity
-
For an OpenShift Restricted SCC compatible installation, run:
helm install --values values.yaml --create-namespace kubeclarity kubeclarity/kubeclarity --namespace kubeclarity --set global.openShiftRestricted=true \
--set kubeclarity-postgresql.securityContext.enabled=false --set kubeclarity-postgresql.containerSecurityContext.enabled=false \
--set kubeclarity-postgresql.volumePermissions.enabled=true --set kubeclarity-postgresql.volumePermissions.securityContext.runAsUser="auto" \
--set kubeclarity-postgresql.shmVolume.chmod.enabled=false
-
Wait until all the pods are in ‘Running’ state. Check the output of the following command:
kubectl get pods --namespace kubeclarity
The output should be similar to:
NAME                                                    READY   STATUS    RESTARTS   AGE
kubeclarity-kubeclarity-7689c7fbb7-nlhh5                1/1     Running   0          82s
kubeclarity-kubeclarity-grype-server-79b6fb4b88-5xtbh   1/1     Running   0          82s
kubeclarity-kubeclarity-postgresql-0                    1/1     Running   0          82s
kubeclarity-kubeclarity-sbom-db-6895d97d5d-55jnj        1/1     Running   0          82s
-
Port-forward to the KubeClarity UI.
kubectl port-forward --namespace kubeclarity svc/kubeclarity-kubeclarity 9999:8080
-
(Optional) Install a sample application (sock shop) to run your scans on.
-
Create a namespace for the application.
kubectl create namespace sock-shop
-
Install the application.
kubectl apply -f https://raw.githubusercontent.com/microservices-demo/microservices-demo/master/deploy/kubernetes/complete-demo.yaml
-
Check that the installation was successful.
kubectl get pods --namespace sock-shop
Expected output:
NAME                            READY   STATUS    RESTARTS   AGE
carts-5dc994cf5b-4rhfj          2/2     Running   0          44h
carts-db-556cbbd5fb-64qls       2/2     Running   0          44h
catalogue-b7b968c97-b9k8p       2/2     Running   0          44h
catalogue-db-f7547dd6-smzk2     2/2     Running   0          44h
front-end-848c97475d-b7sl8      2/2     Running   0          44h
orders-7d47794476-9fjsx         2/2     Running   0          44h
orders-db-bbfb8f8-7ndr6         2/2     Running   0          44h
payment-77bd4bbdf6-hkzh7        2/2     Running   0          44h
queue-master-6d4cf8c4ff-pzk68   2/2     Running   0          44h
rabbitmq-9dd69888f-6lzfh        3/3     Running   0          44h
session-db-7d9d77c495-zngsn     2/2     Running   0          44h
shipping-67fff9d476-t87jw       2/2     Running   0          44h
user-7b667cd8d-q8bg8            2/2     Running   0          44h
user-db-5599d45948-vxpq6        2/2     Running   0          44h
-
Open the KubeClarity UI in your browser at http://localhost:9999/. The KubeClarity dashboard should appear. KubeClarity UI has no data to report vulnerabilities after a fresh install, so there is no data on the dashboard.

-
If you also want to try KubeClarity using its command-line tool, Install the CLI. Otherwise, you can run runtime scans using the dashboard.
Uninstall using Helm
Later if you have finished experimenting with KubeClarity, you can delete the backend by completing the following steps.
-
Helm uninstall
helm uninstall kubeclarity --namespace kubeclarity
-
Clean the resources. By default, Helm doesn’t remove the PVCs and PVs for the StatefulSets. Run the following command to delete them all:
kubectl delete pvc -l app.kubernetes.io/instance=kubeclarity --namespace kubeclarity
Build and run locally with demo data
-
Build the UI and the backend and start the backend locally, either using Docker, or without it:
-
Using docker:
-
Build UI and backend (the image tag is set using VERSION):
VERSION=test make docker-backend
-
Run the backend using demo data:
docker run -p 9999:8080 -e FAKE_RUNTIME_SCANNER=true -e FAKE_DATA=true -e ENABLE_DB_INFO_LOGS=true -e DATABASE_DRIVER=LOCAL ghcr.io/openclarity/kubeclarity:test run
-
Local build:
-
Build UI and backend
-
Copy the built site:
-
Run the backend locally using demo data:
FAKE_RUNTIME_SCANNER=true DATABASE_DRIVER=LOCAL FAKE_DATA=true ENABLE_DB_INFO_LOGS=true ./backend/bin/backend run
-
Open the KubeClarity UI in your browser: http://localhost:9999/
-
Install the CLI.
8.2.3.2 - Install the CLI
KubeClarity includes a CLI that can be run locally and is especially useful for CI/CD pipelines. It allows you to analyze images and directories to generate SBOM, and scan it for vulnerabilities. The results can be exported to the KubeClarity backend.
You can install the KubeClarity CLI using the following methods:
Binary Distribution
- Download the release distribution for your OS from the releases page.
- Unpack the
kubeclarity-cli binary, then add it to your PATH.
Docker Image
A Docker image is available at ghcr.io/openclarity/kubeclarity-cli with list of
available tags here.
Local Compilation
-
Clone the project repo.
-
Run:
-
Copy ./cli/bin/cli to your PATH under kubeclarity-cli.
Next step
Check the common tasks you can do using the web UI.
8.2.3.3 - First tasks - UI
After you have installed the KubeClarity backend and the KubeClarity CLI, complete the following tasks to see the basic functionality of KubeClarity web UI.
Runtime scan
To start a runtime scan, complete the following steps.
-
Open the UI in your browser at http://localhost:9999/.
-
From the navigation bar on the left, select Runtime Scan.
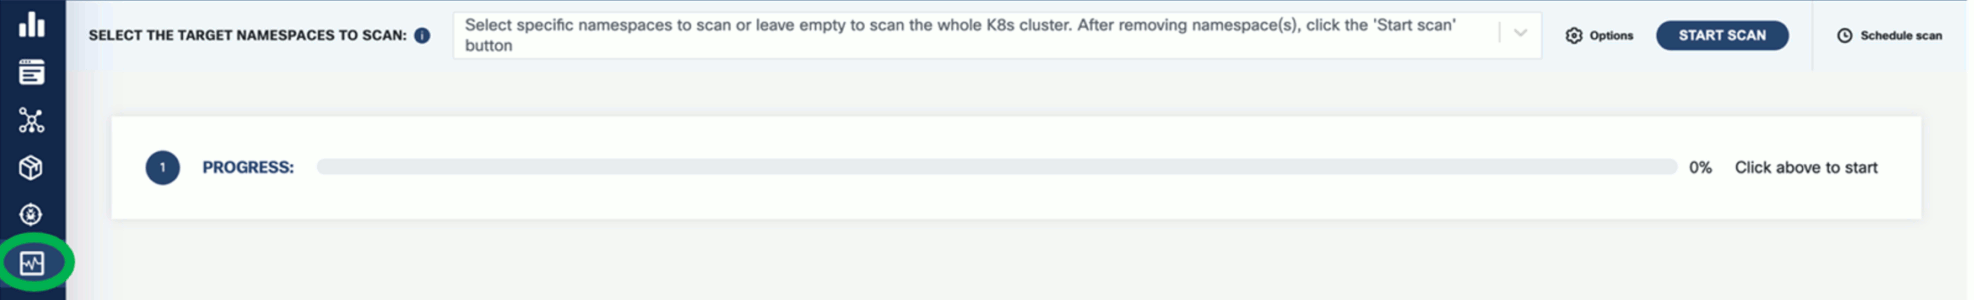
-
Select the namespace you want to scan, for example, the sock-shop namespace if you have installed the demo application, then click START SCAN. You can select multiple namespaces.
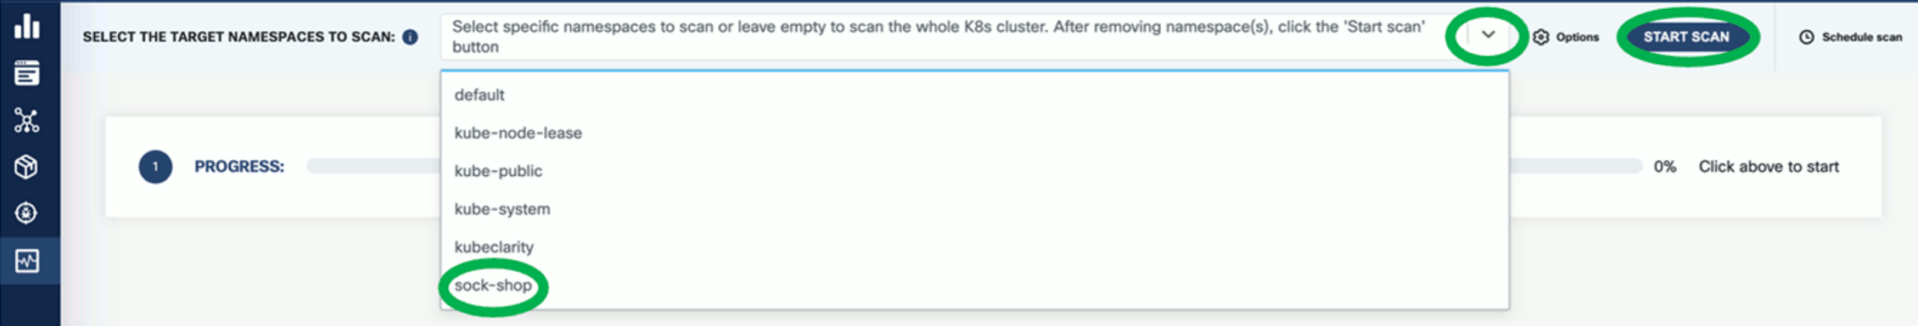
-
Wait until the scan is completed, then check the results. The scan results report the affected components such as Applications, Application Resources, Packages, and Vulnerabilities.
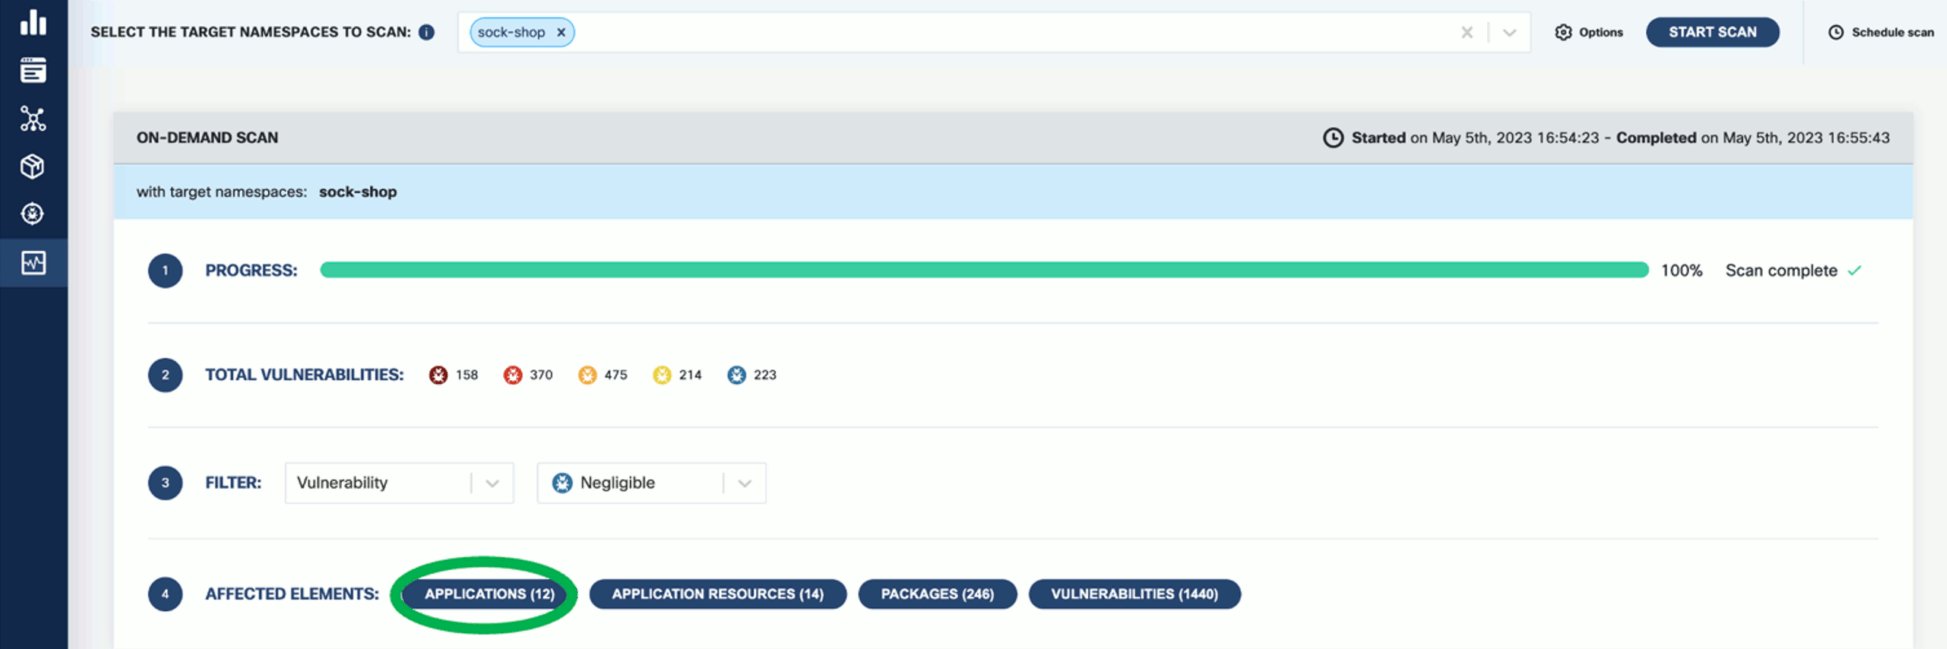
-
Click on these elements for details. For example, Applications shows the applications in the namespace that have vulnerabilities detected.
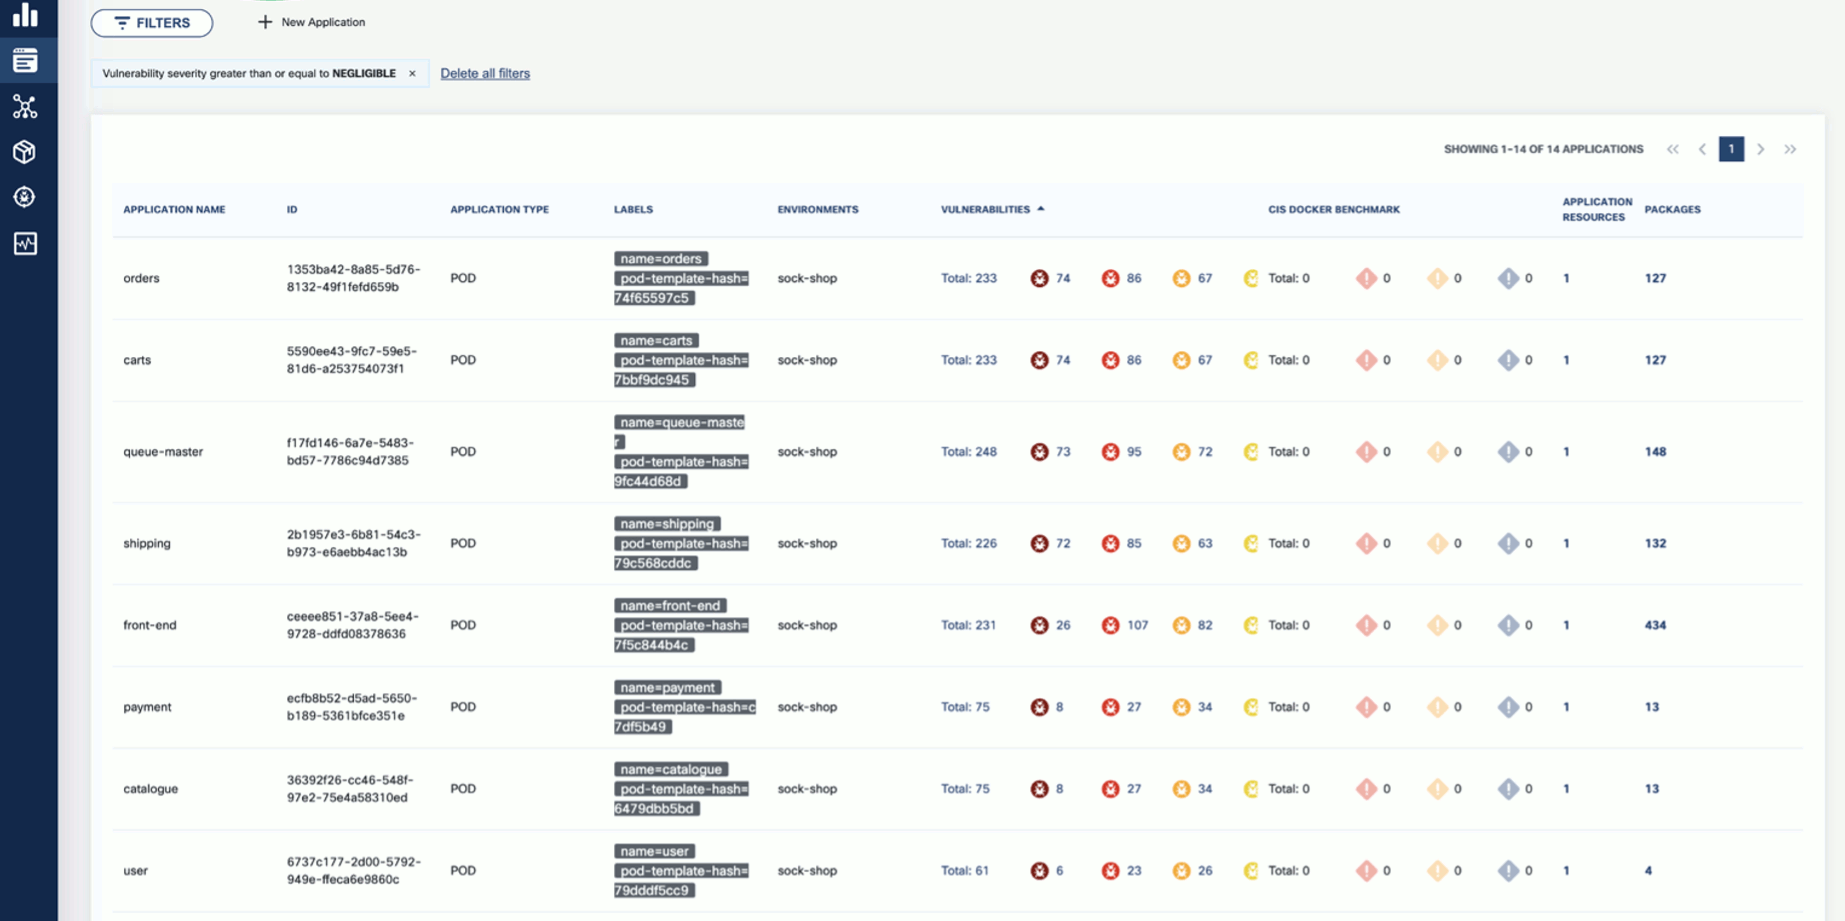
-
Now that you have run a scan, a summary of the results also appears on the dashboard page of the UI.
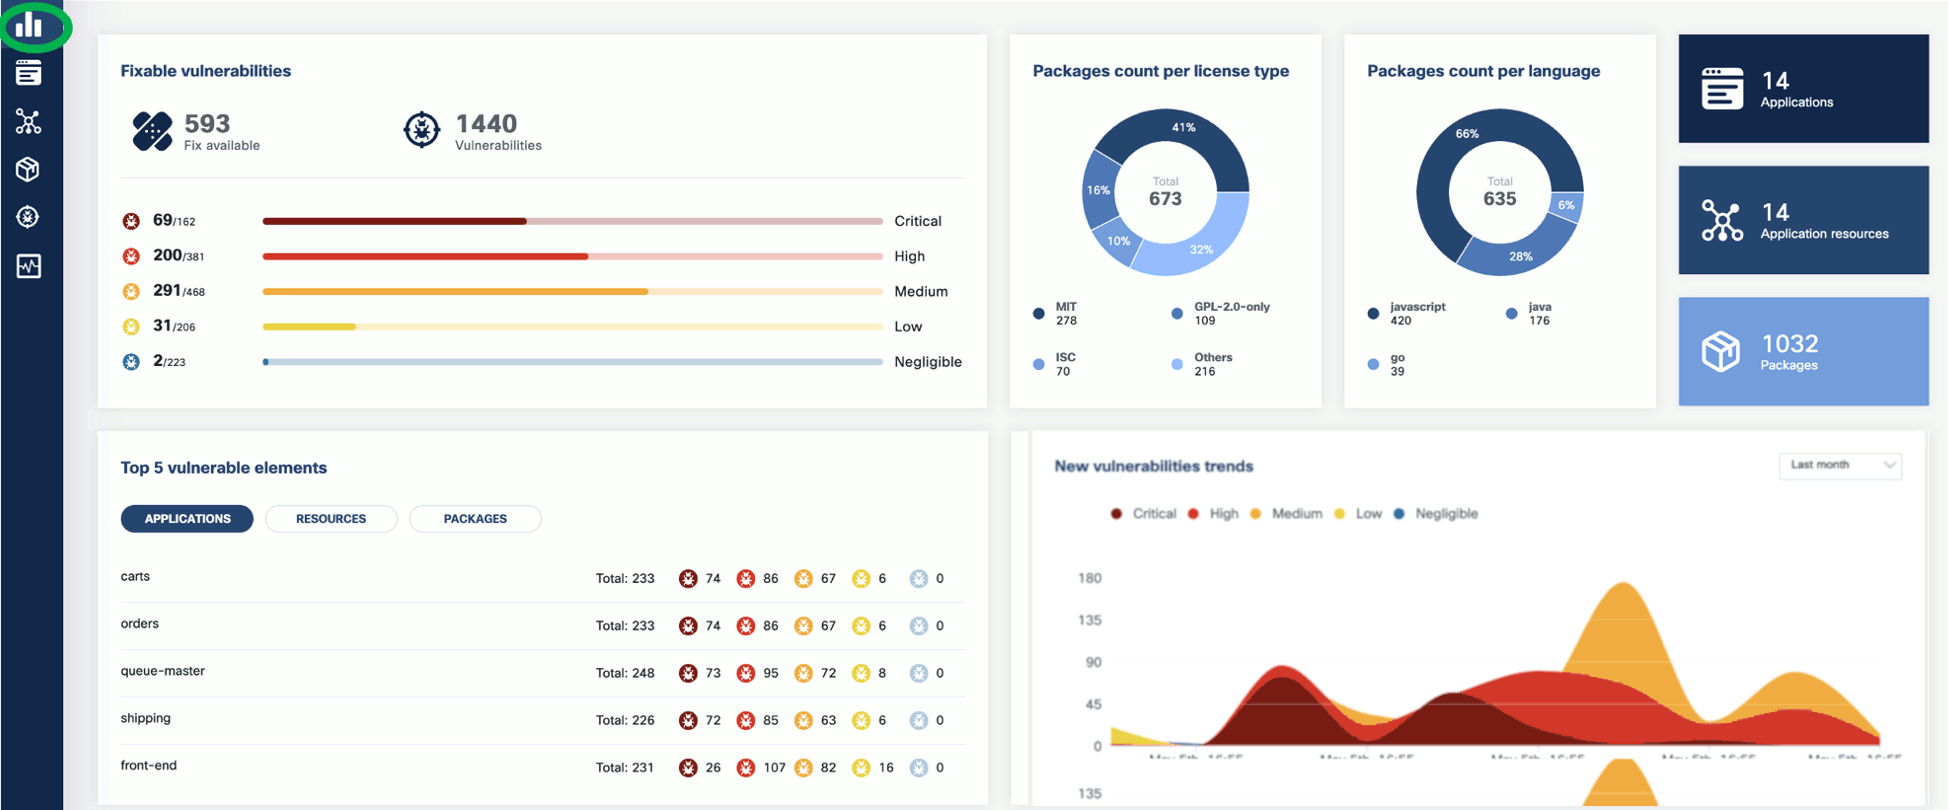
Vulnerability scan
-
To see the results of a vulnerability scan, select the Vulnerabilities page in KubeClarity UI. It shows a report including the vulnerability names, severity, the package of origin, available fixes, and attribution to the scanner that reported the vulnerability.
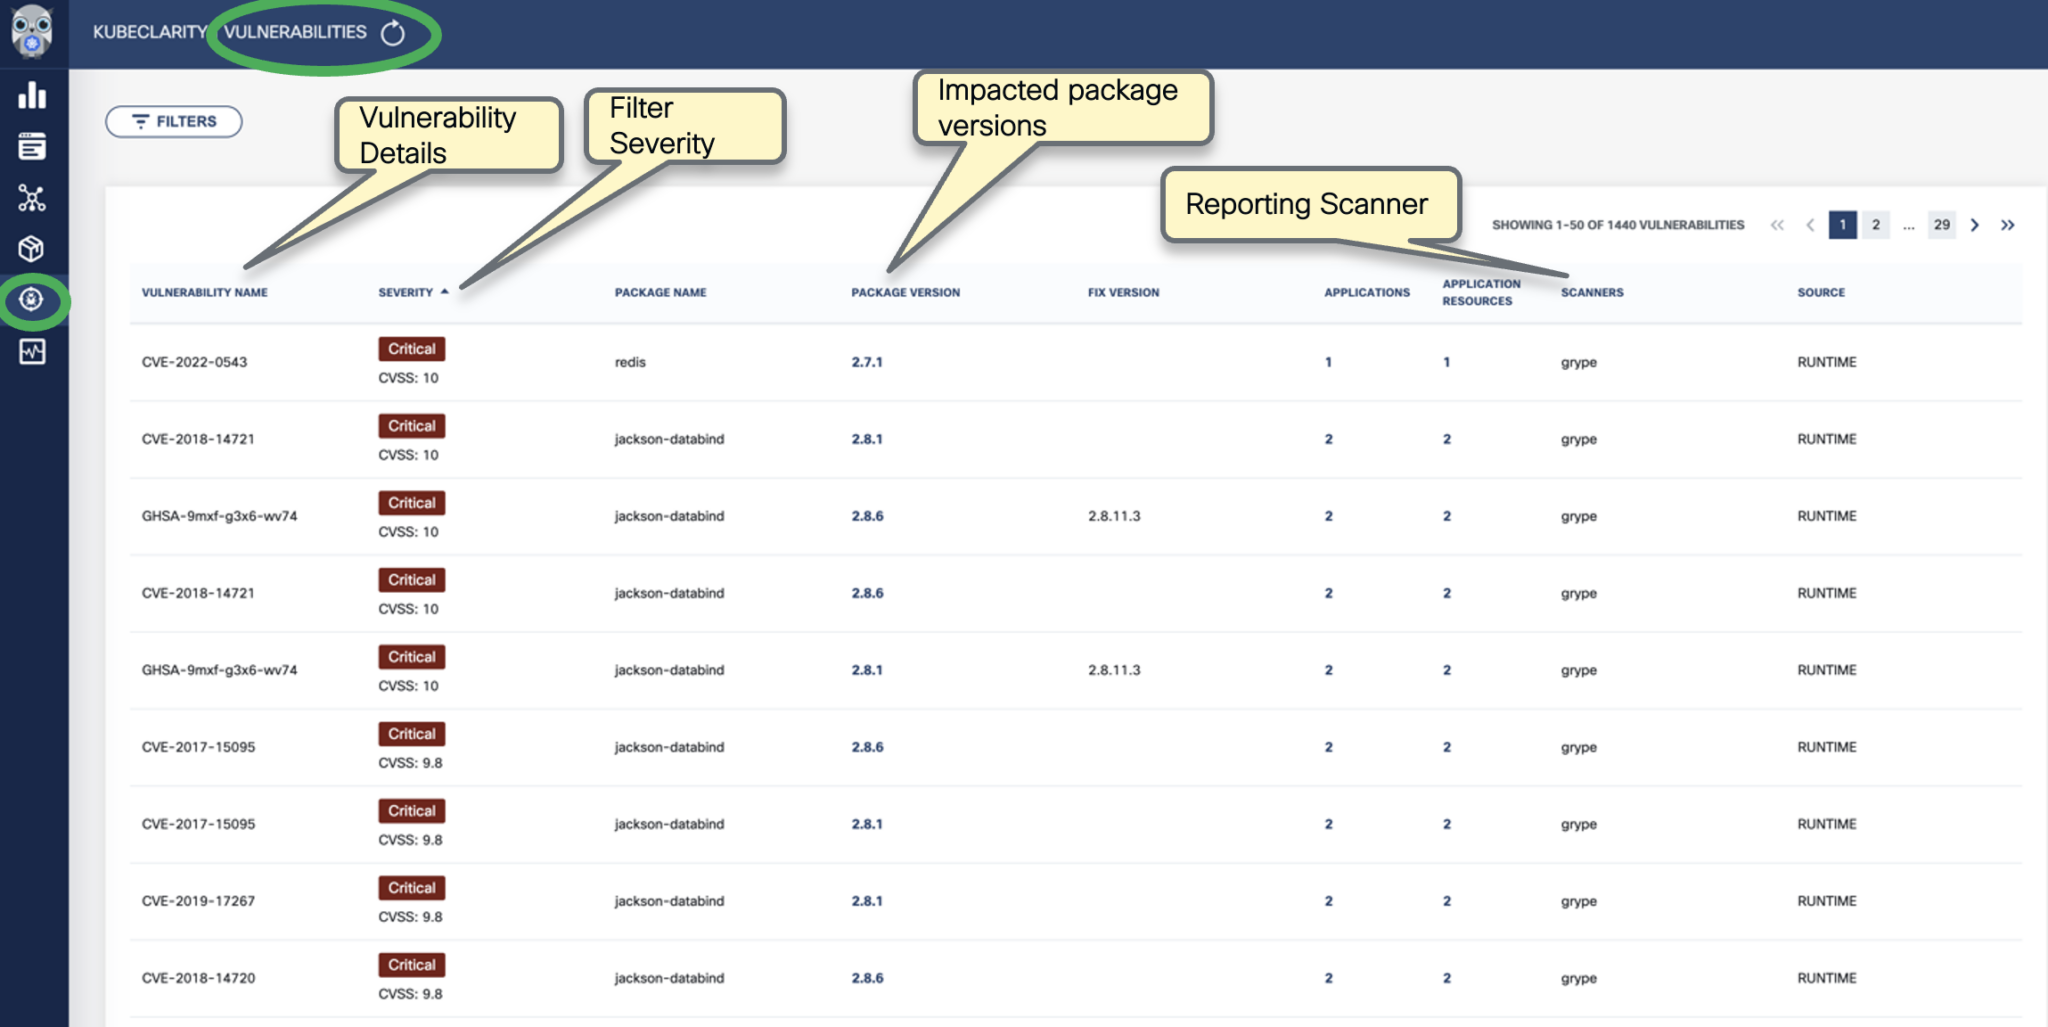
-
You can click on any of these fields to access more in-depth information. For example, click on the name of a vulnerability in the VULNERABILITY NAME column.
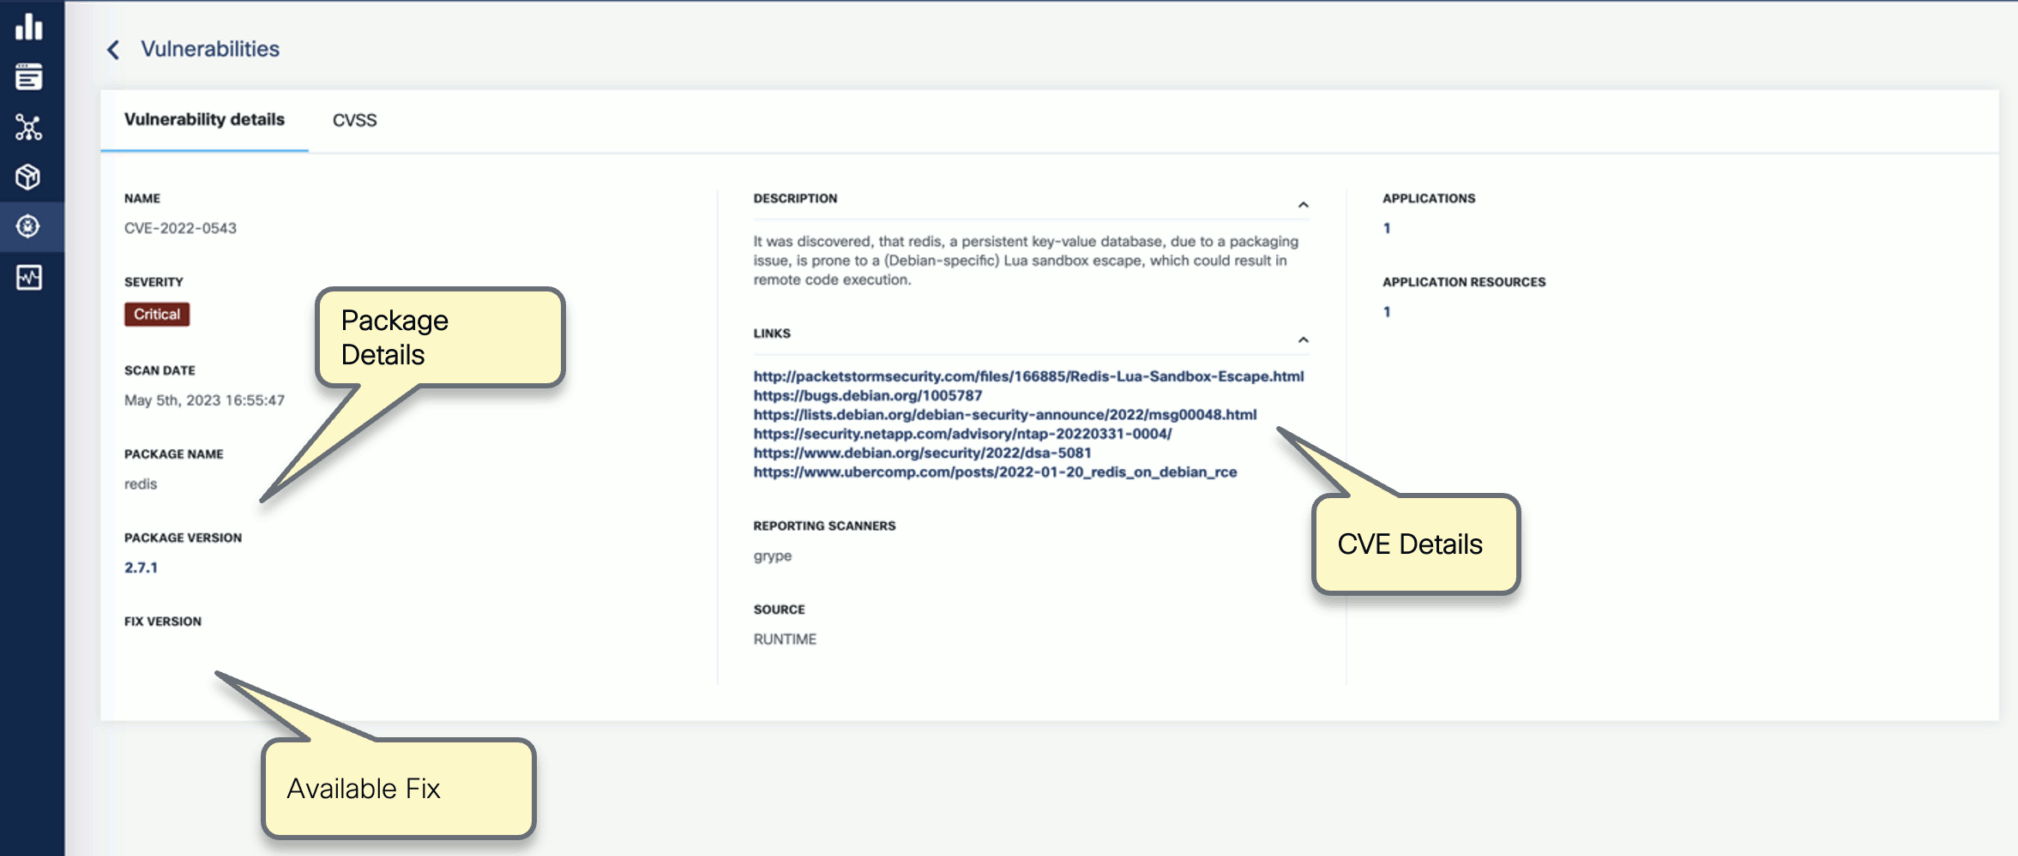
-
Select CVSS to show the CVSS scores and other details reported from the scanning process.
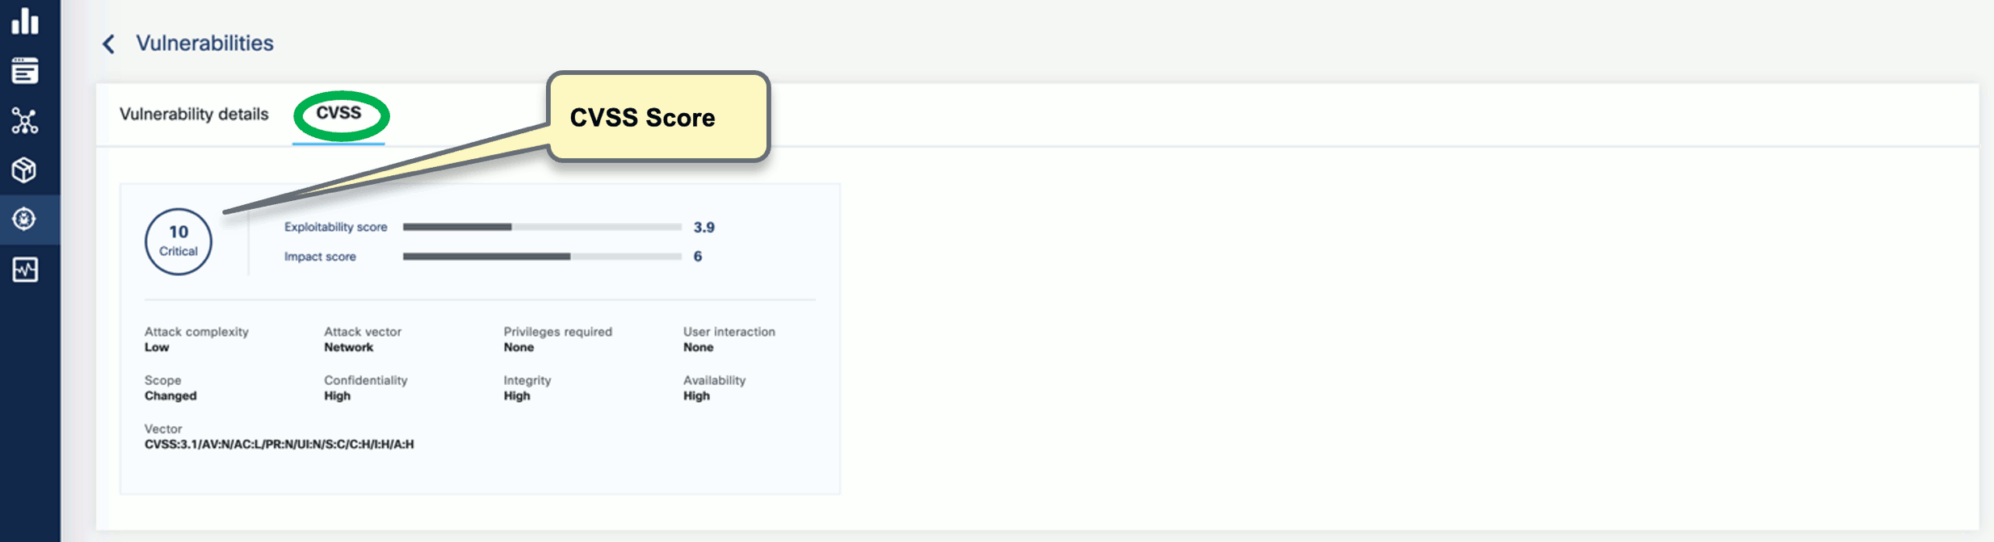
-
Navigate back to the Vulnerabilities view to explore the filtering options. Filtering helps you reduce noise and improve efficiency in identifying and potentially fixing crucial vulnerabilities.
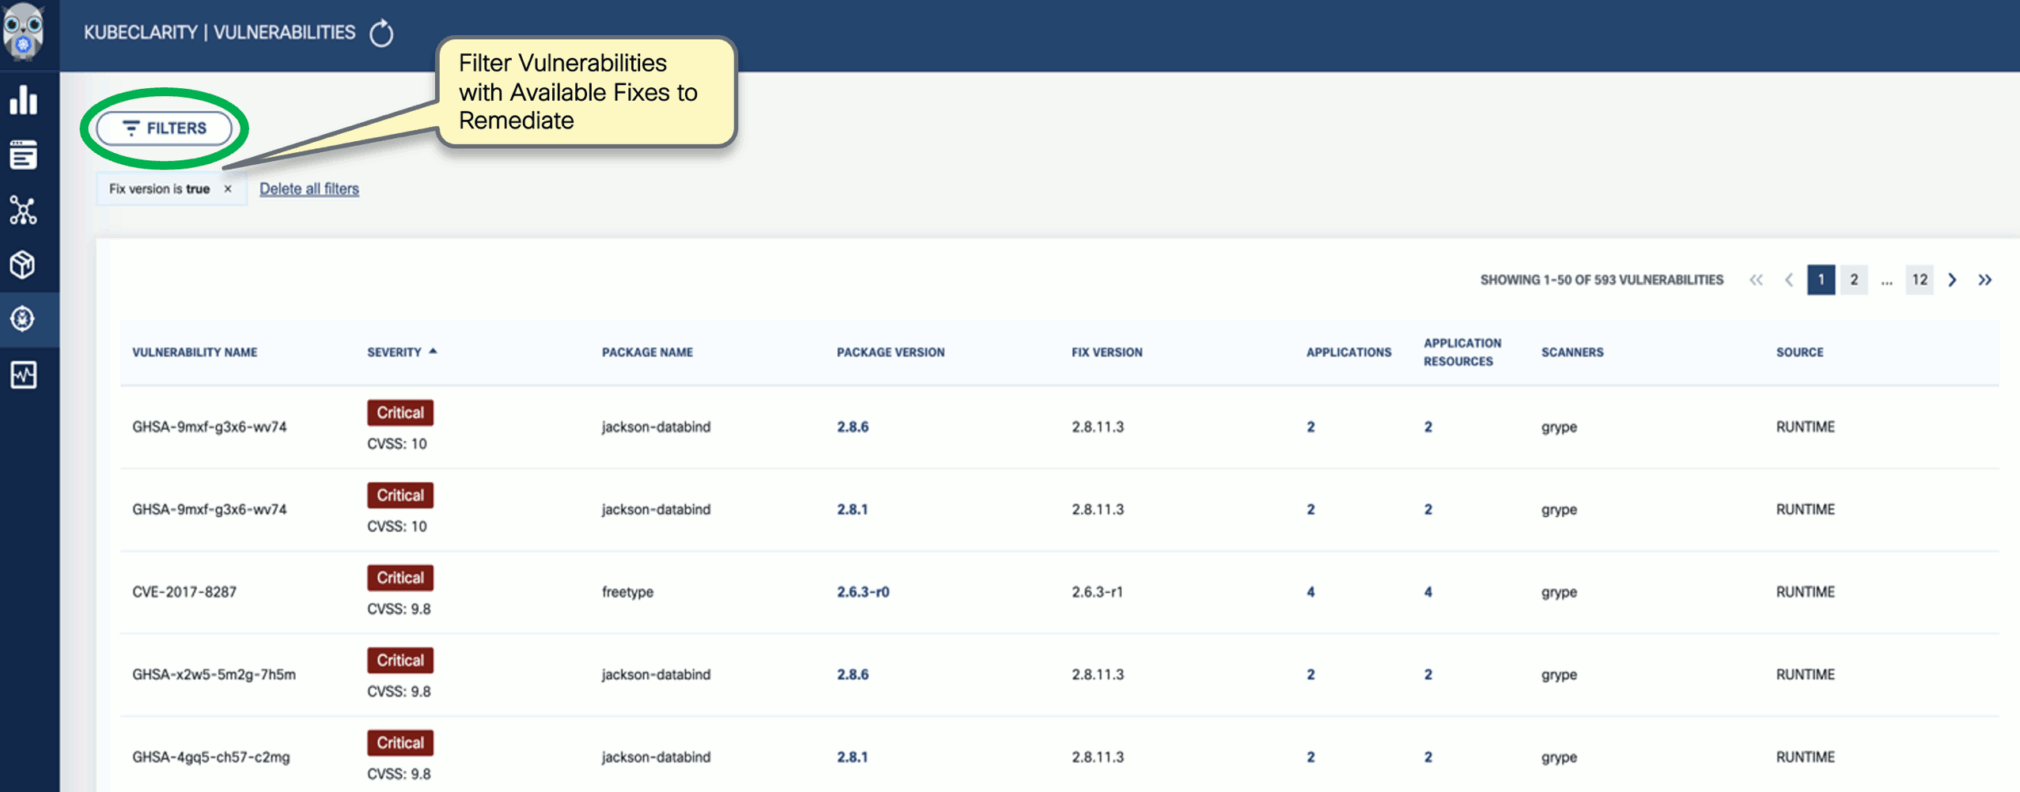
-
The KubeClarity Dashboard gives you insights into vulnerability trends and fixable vulnerabilities.
Next step
Check the common tasks you can do using the CLI tool.
8.2.3.4 - First tasks - CLI
After you have installed the KubeClarity backend and the KubeClarity CLI, and completed the first tasks on the UI, complete the following tasks to see the basic functionality of the KubeClarity CLI.
Generate SBOM
To generate the Software Bill of Materials (SBOM), complete the following steps.
-
Run the following command.
kubeclarity-cli analyze <image/directory name> --input-type <dir|file|image(default)> -o <output file or stdout>
For example:
kubeclarity-cli analyze --input-type image nginx:latest -o nginx.sbom
Example output:
INFO[0000] Called syft analyzer on source registry:nginx:latest  analyzer=syft app=kubeclarity
INFO[0004] Skipping analyze unsupported source type: image  analyzer=gomod app=kubeclarity
INFO[0004] Sending successful results                    analyzer=syft app=kubeclarity
INFO[0004] Got result for job "syft"                     app=kubeclarity
INFO[0004] Got result for job "gomod"                    app=kubeclarity
INFO[0004] Skip generating hash in the case of image
-
Verify that the ngnix.sbom file is generated and explore its contents as in below:
Example output:
{
  "bomFormat": "CycloneDX",
  "specVersion": "1.4",
  "serialNumber": "urn:uuid:8cca2aa3-1aaa-4e8c-9d44-08e88b1df50d",
  "version": 1,
  "metadata": {
    "timestamp": "2023-05-19T16:27:27-07:00",
    "tools": [
      {
        "vendor": "kubeclarity",
-
To run also the trivy scanner and merge the output into a single SBOM, run:
ANALYZER_LIST="syft gomod trivy" kubeclarity-cli analyze --input-type image nginx:latest -o nginx.sbom
Example output:
INFO[0000] Called syft analyzer on source registry:nginx:latest  analyzer=syft app=kubeclarity
INFO[0004] Called trivy analyzer on source image nginx:latest  analyzer=trivy app=kubeclarity
INFO[0004] Skipping analyze unsupported source type: image  analyzer=gomod app=kubeclarity
INFO[0005] Sending successful results                    analyzer=syft app=kubeclarity
INFO[0005] Sending successful results                    analyzer=trivy app=kubeclarity
INFO[0005] Got result for job "trivy"                    app=kubeclarity
INFO[0005] Got result for job "syft"                     app=kubeclarity
INFO[0005] Got result for job "gomod"                    app=kubeclarity
INFO[0005] Skip generating hash in the case of image
Vulnerability scan
You can scan vulnerabilities by running the appropriate commands. The CLI provides flexibility and automation capabilities for integrating vulnerability scanning into your existing workflows or CI/CD pipelines. The tool allows scanning an image, directory, file, or a previously generated SBOM.
Usage:
kubeclarity-cli scan <image/sbom/directory/file name> --input-type <sbom|dir|file|image(default)> -f <output file>
Example:
kubeclarity-cli scan nginx.sbom --input-type sbom
You can list the vulnerability scanners to use using the SCANNERS_LIST environment variable separated by a space (SCANNERS_LIST="<Scanner1 name> <Scanner2 name>"). For example:
SCANNERS_LIST="grype trivy" kubeclarity-cli scan nginx.sbom --input-type sbom
Example output:
INFO[0000] Called trivy scanner on source sbom nginx.sbom  app=kubeclarity scanner=trivy
INFO[0000] Loading DB. update=true                       app=kubeclarity mode=local scanner=grype
INFO[0000] Need to update DB                             app=kubeclarity scanner=trivy
INFO[0000] DB Repository: ghcr.io/aquasecurity/trivy-db  app=kubeclarity scanner=trivy
INFO[0000] Downloading DB...                             app=kubeclarity scanner=trivy
INFO[0010] Gathering packages for source sbom:nginx.sbom  app=kubeclarity mode=local scanner=grype
INFO[0010] Found 136 vulnerabilities                     app=kubeclarity mode=local scanner=grype
INFO[0011] Sending successful results                    app=kubeclarity mode=local scanner=grype
INFO[0011] Got result for job "grype"                    app=kubeclarity
INFO[0012] Vulnerability scanning is enabled             app=kubeclarity scanner=trivy
INFO[0012] Detected SBOM format: cyclonedx-json          app=kubeclarity scanner=trivy
INFO[0012] Detected OS: debian                           app=kubeclarity scanner=trivy
INFO[0012] Detecting Debian vulnerabilities...           app=kubeclarity scanner=trivy
INFO[0012] Number of language-specific files: 1          app=kubeclarity scanner=trivy
INFO[0012] Detecting jar vulnerabilities...              app=kubeclarity scanner=trivy
INFO[0012] Sending successful results                    app=kubeclarity scanner=trivy
INFO[0012] Found 136 vulnerabilities                     app=kubeclarity scanner=trivy
INFO[0012] Got result for job "trivy"                    app=kubeclarity
INFO[0012] Merging result from "grype"                   app=kubeclarity
INFO[0012] Merging result from "trivy"                   app=kubeclarity
NAME              INSTALLED                FIXED-IN  VULNERABILITY     SEVERITY    SCANNERS
curl              7.74.0-1.3+deb11u7                 CVE-2023-23914    CRITICAL    grype(*), trivy(*)
curl              7.74.0-1.3+deb11u7                 CVE-2023-27536    CRITICAL    grype(*), trivy(*)
libcurl4          7.74.0-1.3+deb11u7                 CVE-2023-27536    CRITICAL    grype(*), trivy(*)
libdb5.3          5.3.28+dfsg1-0.8                   CVE-2019-8457     CRITICAL    grype(*), trivy(*)
libcurl4          7.74.0-1.3+deb11u7                 CVE-2023-23914    CRITICAL    grype(*), trivy(*)
perl-base         5.32.1-4+deb11u2                   CVE-2023-31484    HIGH        grype(*), trivy(*)
libss2            1.46.2-2                           CVE-2022-1304     HIGH        grype(*), trivy(*)
bash              5.1-2+deb11u1                      CVE-2022-3715     HIGH        grype(*), trivy(*)
Export results to KubeClarity backend
To export the CLI results to the KubeClarity backend, complete the following steps.
-
To export CLI-generated results to the backend, from the left menu bar select Applications, then copy the ID from the KubeClarity UI. If your application is not listed yet, select + New Application, and create a new pod.
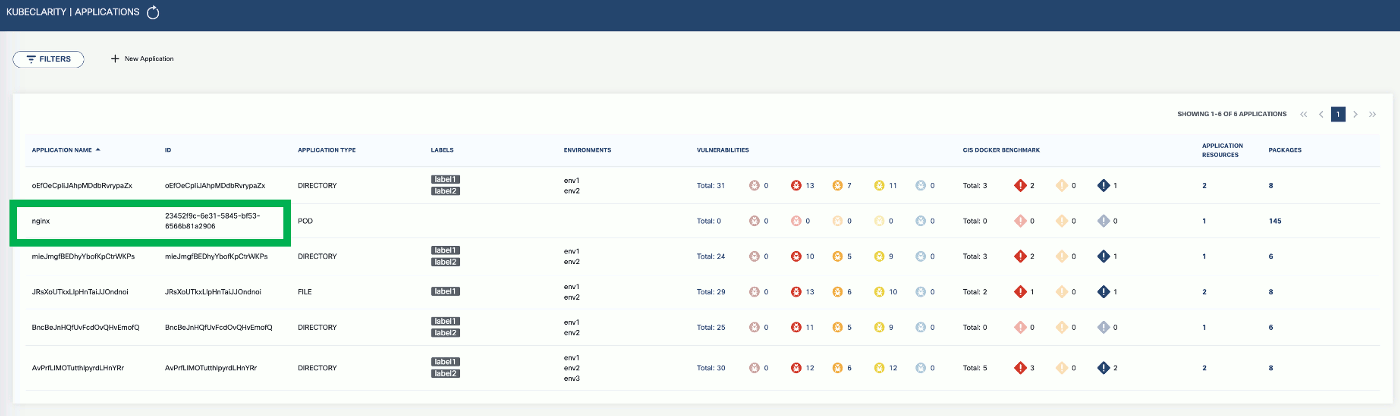
-
To export the generated SBOMs to a running KubeClarity backend pod, use the -e flag and the ID as the <application ID> value in the following command.
BACKEND_HOST=<KubeClarity backend address> BACKEND_DISABLE_TLS=true kubeclarity-cli analyze <image> --application-id <application ID> -e -o <SBOM output file>
For example:
BACKEND_HOST=localhost:9999 BACKEND_DISABLE_TLS=true kubeclarity-cli analyze nginx:latest --application-id 23452f9c-6e31-5845-bf53-6566b81a2906 -e -o nginx.sbom
Example output:
INFO[0000] Called syft analyzer on source registry:nginx:latest  analyzer=syft app=kubeclarity
INFO[0004] Called trivy analyzer on source image nginx:latest  analyzer=trivy app=kubeclarity
INFO[0004] Skipping analyze unsupported source type: image  analyzer=gomod app=kubeclarity
INFO[0004] Sending successful results                    analyzer=syft app=kubeclarity
INFO[0004] Got result for job "syft"                     app=kubeclarity
INFO[0004] Got result for job "gomod"                    app=kubeclarity
INFO[0004] Sending successful results                    analyzer=trivy app=kubeclarity
INFO[0004] Got result for job "trivy"                    app=kubeclarity
INFO[0004] Skip generating hash in the case of image
INFO[0004] Exporting analysis results to the backend: localhost:8080  app=kubeclarity
-
To export the vulnerability scan results to the KubeClarity backend, set the BACKEND_HOST environment variable and the -e flag.
Note: Until TLS is supported, set BACKEND_DISABLE_TLS=true.
BACKEND_HOST=<KubeClarity backend address> BACKEND_DISABLE_TLS=true kubeclarity-cli scan <image> --application-id <application ID> -e
For example:
SCANNERS_LIST="grype" BACKEND_HOST=localhost:9999 BACKEND_DISABLE_TLS=true kubeclarity-cli scan nginx.sbom --input-type sbom --application-id 23452f9c-6e31-5845-bf53-6566b81a2906 -e
- Now you can see the exported results on the UI, for example, on the Dashboard page.
Next step
Now that you have finished the getting started guide, explore the UI, or check the documentation for other use cases.
8.2.4 - Generate SBOM
A software bill of materials (SBOM) is a list of all the components, libraries, and other dependencies that make up a software application, along with information about the versions, licenses, and vulnerabilities associated with each component. They are formal, structured documents detailing the components of a software product and its supply chain relationships.
KubeClarity exposes SBOM generator integration settings via the values.yaml file.
OpenClarity content analyzer integrates with the following SBOM generators:
Trivy has an extensive vulnerability database, which includes CVEs from various sources such as NVD, Red Hat, and Debian. It can detect vulnerabilities in multiple programming languages, including Java, Python, and Ruby.
Syft’s vulnerability database is smaller and primarily focuses on detecting vulnerabilities in Python libraries.
KubeClarity, by default, enables Syft and CycloneDX gomod analyzers. To enable the Trivy scanner, edit the values. yaml file like this:
    analyzer:
      ## Space separated list of analyzers. (syft gomod)
      analyzerList: "syft gomod trivy"
      analyzerScope: "squashed"

      trivy:
        ## Enable trivy scanner, if true make sure to add it to list above
        enabled: true
        timeout: "300"
SBOM database
KubeClarity automatically deploys an SBOM database pod and caches the generated SBOMs in the SBOM DB. The database is a lightweight SQLite DB that avoids persistent volume storage overheads. It stores and retrieves SBOM documents in a string format and serves as a caching function for rendering SBOM data. The DB does not store or query JSON objects to parse or query the SBOMs. However, it supports a gzip compression and base64 encoded storage to reduce memory footprint.
Here is the corresponding configuration snippet from the values.yaml file:
## KubeClarity SBOM DB Values

kubeclarity-sbom-db:
  ## Docker Image values.
  docker:
    ## Use to overwrite the global docker params
    ##
    imageName: ""

  ## Logging level (debug, info, warning, error, fatal, panic).
  logLevel: warning

  servicePort: 8080

  resources:
    requests:
      memory: "20Mi"
      cpu: "10m"
    limits:
      memory: "100Mi"
      cpu: "100m"

## End of KubeClarity SBOM DB Values
8.2.4.1 - Generate SBOM
To generate the Software Bill of Materials (SBOM), complete the following steps.
-
Run the following command.
kubeclarity-cli analyze <image/directory name> --input-type <dir|file|image(default)> -o <output file or stdout>
For example:
kubeclarity-cli analyze --input-type image nginx:latest -o nginx.sbom
Example output:
INFO[0000] Called syft analyzer on source registry:nginx:latest  analyzer=syft app=kubeclarity
INFO[0004] Skipping analyze unsupported source type: image  analyzer=gomod app=kubeclarity
INFO[0004] Sending successful results                    analyzer=syft app=kubeclarity
INFO[0004] Got result for job "syft"                     app=kubeclarity
INFO[0004] Got result for job "gomod"                    app=kubeclarity
INFO[0004] Skip generating hash in the case of image
-
Verify that the ngnix.sbom file is generated and explore its contents as in below:
Example output:
{
  "bomFormat": "CycloneDX",
  "specVersion": "1.4",
  "serialNumber": "urn:uuid:8cca2aa3-1aaa-4e8c-9d44-08e88b1df50d",
  "version": 1,
  "metadata": {
    "timestamp": "2023-05-19T16:27:27-07:00",
    "tools": [
      {
        "vendor": "kubeclarity",
-
To run also the trivy scanner and merge the output into a single SBOM, run:
ANALYZER_LIST="syft gomod trivy" kubeclarity-cli analyze --input-type image nginx:latest -o nginx.sbom
Example output:
INFO[0000] Called syft analyzer on source registry:nginx:latest  analyzer=syft app=kubeclarity
INFO[0004] Called trivy analyzer on source image nginx:latest  analyzer=trivy app=kubeclarity
INFO[0004] Skipping analyze unsupported source type: image  analyzer=gomod app=kubeclarity
INFO[0005] Sending successful results                    analyzer=syft app=kubeclarity
INFO[0005] Sending successful results                    analyzer=trivy app=kubeclarity
INFO[0005] Got result for job "trivy"                    app=kubeclarity
INFO[0005] Got result for job "syft"                     app=kubeclarity
INFO[0005] Got result for job "gomod"                    app=kubeclarity
INFO[0005] Skip generating hash in the case of image
Export scan results to backend
-
To export CLI-generated results to the backend, from the left menu bar select Applications, then copy the ID from the KubeClarity UI. If your application is not listed yet, select + New Application, and create a new pod.
-
To export the generated SBOMs to a running KubeClarity backend pod, use the -e flag and the ID as the <application ID> value in the following command.
BACKEND_HOST=<KubeClarity backend address> BACKEND_DISABLE_TLS=true kubeclarity-cli analyze <image> --application-id <application ID> -e -o <SBOM output file>
For example:
BACKEND_HOST=localhost:9999 BACKEND_DISABLE_TLS=true kubeclarity-cli analyze nginx:latest --application-id 23452f9c-6e31-5845-bf53-6566b81a2906 -e -o nginx.sbom
Example output:
INFO[0000] Called syft analyzer on source registry:nginx:latest  analyzer=syft app=kubeclarity
INFO[0004] Called trivy analyzer on source image nginx:latest  analyzer=trivy app=kubeclarity
INFO[0004] Skipping analyze unsupported source type: image  analyzer=gomod app=kubeclarity
INFO[0004] Sending successful results                    analyzer=syft app=kubeclarity
INFO[0004] Got result for job "syft"                     app=kubeclarity
INFO[0004] Got result for job "gomod"                    app=kubeclarity
INFO[0004] Sending successful results                    analyzer=trivy app=kubeclarity
INFO[0004] Got result for job "trivy"                    app=kubeclarity
INFO[0004] Skip generating hash in the case of image
INFO[0004] Exporting analysis results to the backend: localhost:8080  app=kubeclarity
-
Now you can see the exported results on the UI, on the Dashboard and the Packages pages.

Run multiple generators
You can list the content analyzers to use using the ANALYZER_LIST environment variable separated by a space (ANALYZER_LIST="<analyzer 1 name> <analyzer 2 name>"). For example:
ANALYZER_LIST="syft gomod" kubeclarity-cli analyze --input-type image nginx:latest -o nginx.sbom
OpenClarity content analyzer integrates with the following SBOM generators:
8.2.4.2 - Merging SBOM results
Different SBOM generators support different outputs, and the different vulnerability analyzers support different input SBOM formats. KubeClarity merges the output of multiple SBOM scanners and converts them into the format required by vulnerability scanners.

When multiple analyzers identify the same resources, KubeClarity handles them as a union and labels both analyzers as the source. Instead of attempting to merge the raw data produced by each generator, KubeClarity adds additional metadata to the generated SBOMs while keeping the raw data untouched, as reported by the analyzers.
KubeClarity can also merge SBOMs from various stages of a CI/CD pipeline into a single SBOM by layering and merging, for example, application dependency SBOM analysis from application build time can be augmented with the image dependencies analysis during the image build phase. The merged SBOMs serve as inputs to vulnerability scanners after proper formatting.

8.2.4.3 - SBOM output format
The kubeclarity-cli analyze command can format the resulting SBOM into different formats to integrate with another system. The supported formats are:
| Format | Configuration Name |
| CycloneDX JSON (default) | cyclonedx-json |
| CycloneDX XML | cyclonedx-xml |
| SPDX JSON | spdx-json |
| SPDX Tag Value | spdx-tv |
| Syft JSON | syft-json |
CAUTION:
KubeClarity processes CycloneDX internally, the other formats are supported through a conversion. The conversion process can be lossy due to incompatibilities between formats, therefore in some cases not all fields/information are present in the resulting output.
To configure the kubeclarity-cli to use a format other than the default, the ANALYZER_OUTPUT_FORMAT environment variable can be used with the configuration name from above:
ANALYZER_OUTPUT_FORMAT="spdx-json" kubeclarity-cli analyze nginx:latest -o nginx.sbom
8.2.5 - Runtime scan
Scanning your runtime Kubernetes clusters is essential to proactively detect and address vulnerabilities in real-time, ensuring the security and integrity of your applications and infrastructure. By continuously monitoring and scanning your clusters, you can mitigate risks, prevent potential attacks, and maintain a strong security posture in the dynamic Kubernetes environment.
For details on the concepts of KubeClarity runtime scan, see Kubernetes cluster runtime scan.
8.2.5.1 - Run a runtime scan
To start a runtime scan, complete the following steps.
-
Open the UI in your browser at http://localhost:9999/.
-
From the navigation bar on the left, select Runtime Scan.
-
Select the namespace you want to scan, for example, the sock-shop namespace if you have installed the demo application, then click START SCAN. You can select multiple namespaces.
-
Wait until the scan is completed, then check the results. The scan results report the affected components such as Applications, Application Resources, Packages, and Vulnerabilities.
-
Click on these elements for details. For example, Applications shows the applications in the namespace that have vulnerabilities detected.
-
Now that you have run a scan, a summary of the results also appears on the dashboard page of the UI.
8.2.5.2 - Schedule runtime scan
To schedule a runtime scan that runs at a specific time, complete the following steps. You can also configure recurring scans to periodically scan your namespaces.
-
Open the UI in your browser at http://localhost:9999/.
-
From the navigation bar on the left, select Runtime Scan.
-
Click Schedule Scan.

-
Select the namespace or namespaces you want to scan.

-
(Optional) If you have already configured CIS benchmarks, you can select CIS Docker Benchmark to enable them for the scheduled scan.
-
Set the type of the scan.
- Later: Run the scan once at the specified time.
- Repetitive: A recurring scan that runs periodically.

-
Set the time of the scan, then click SAVE.
- For a one-time scan, set the date and time when it should run.
- For a repetitive scan, set its frequency.

8.2.5.3 - Configure CIS benchmarks
Developed by the Center for Internet Security (CIS), CIS benchmarks provide industry-recognized guidelines and recommendations for securing systems, networks, and software applications.
CIS Benchmarks are consensus-based guidelines that outline recommended security configurations and settings for various technology platforms, including operating systems, databases, web servers, and more. For more details, see CIS Docker Benchmark: Guidance for securing Docker containers and
CIS Kubernetes Benchmark: Guidance for securing Kubernetes clusters.
By following these steps and customizing the CIS benchmarks configuration in the values.yaml file, you can effectively run and assess your Kubernetes cluster’s adherence to the CIS benchmarks and evaluate fatal, info, and warning level findings. To configure KubeClarity for running CIS benchmarks, complete the following steps.
-
Clone or download the KubeClarity repository to your local machine, and open the values.yaml file in a text editor.
-
Locate the cis-docker-benchmark-scanner section.
-
Customize the configuration based on your specific requirements. You can enable or disable specific CIS benchmarks, set thresholds, and define compliance levels.
For example:
cis-docker-benchmark-scanner:
## Docker Image values.
docker:
  ## Use to overwrite the global docker params
  ##
  imageName: ""

## Scanner logging level (debug, info, warning, error, fatal, panic).
logLevel: warning

## Timeout for the cis docker benchmark scanner job.
timeout: "2m"

resources:
  requests:
    memory: "50Mi"
    cpu: "50m"
  limits:
    memory: "1000Mi"
    cpu: "1000m"
-
Save the changes to the configuration file.
-
Deploy the KubeClarity backend in your Kubernetes cluster using the modified values.yaml file.
-
Once KubeClarity is up and running, it automatically applies the configured CIS benchmarks and evaluates your Kubernetes cluster against them.
-
Monitor the KubeClarity dashboard, or check the generated reports to review your cluster’s compliance with the CIS benchmarks.
Enable CIS benchmarks
To enable the configured benchmark scans for on-demand runtime scans, complete the following steps.
-
Open the UI in your browser at http://localhost:9999/.
-
From the navigation bar on the left, select Runtime Scan, then Options.

-
Enable the CIS Docker Benchmark option, then click SAVE.

CIS benchmark results
-
If you run a scan with CIS benchmarks enabled, the scan results are shown in the scan report:

-
You can drill down further by applying filters. The filter allows you to narrow down the results and focus on the specific aspects you are interested in. Use the provided filters to navigate the CIS benchmark details and access the necessary information for your compliance analysis.

-
Click on a group in the AFFECTED ELEMENTS row to see the alerts and the details.
-
Click CIS Docker Benchmark to see a drill-down view of CIS Benchmarks and a detailed benchmark description. This deeper level of visibility enables you to investigate and address the alerts more effectively, ensuring the security and compliance of your Kubernetes environment.

8.2.6 - Vulnerability scan
Vulnerability scanning identifies weak spots in software code and dependencies. Vulnerability scanners can identify infrastructure, networks, applications, or website vulnerabilities. These tools scan various target systems for security flaws that attackers could exploit.
8.2.6.1 - Run a vulnerability scan
You can scan vulnerabilities by running the appropriate commands. The CLI provides flexibility and automation capabilities for integrating vulnerability scanning into your existing workflows or CI/CD pipelines. The tool allows scanning an image, directory, file, or a previously generated SBOM.
Usage:
kubeclarity-cli scan <image/sbom/directory/file name> --input-type <sbom|dir|file|image(default)> -f <output file>
Example:
kubeclarity-cli scan nginx.sbom --input-type sbom
You can list the vulnerability scanners to use using the SCANNERS_LIST environment variable separated by a space (SCANNERS_LIST="<Scanner1 name> <Scanner2 name>"). For example:
SCANNERS_LIST="grype trivy" kubeclarity-cli scan nginx.sbom --input-type sbom
Example output:
INFO[0000] Called trivy scanner on source sbom nginx.sbom  app=kubeclarity scanner=trivy
INFO[0000] Loading DB. update=true                       app=kubeclarity mode=local scanner=grype
INFO[0000] Need to update DB                             app=kubeclarity scanner=trivy
INFO[0000] DB Repository: ghcr.io/aquasecurity/trivy-db  app=kubeclarity scanner=trivy
INFO[0000] Downloading DB...                             app=kubeclarity scanner=trivy
INFO[0010] Gathering packages for source sbom:nginx.sbom  app=kubeclarity mode=local scanner=grype
INFO[0010] Found 136 vulnerabilities                     app=kubeclarity mode=local scanner=grype
INFO[0011] Sending successful results                    app=kubeclarity mode=local scanner=grype
INFO[0011] Got result for job "grype"                    app=kubeclarity
INFO[0012] Vulnerability scanning is enabled             app=kubeclarity scanner=trivy
INFO[0012] Detected SBOM format: cyclonedx-json          app=kubeclarity scanner=trivy
INFO[0012] Detected OS: debian                           app=kubeclarity scanner=trivy
INFO[0012] Detecting Debian vulnerabilities...           app=kubeclarity scanner=trivy
INFO[0012] Number of language-specific files: 1          app=kubeclarity scanner=trivy
INFO[0012] Detecting jar vulnerabilities...              app=kubeclarity scanner=trivy
INFO[0012] Sending successful results                    app=kubeclarity scanner=trivy
INFO[0012] Found 136 vulnerabilities                     app=kubeclarity scanner=trivy
INFO[0012] Got result for job "trivy"                    app=kubeclarity
INFO[0012] Merging result from "grype"                   app=kubeclarity
INFO[0012] Merging result from "trivy"                   app=kubeclarity
NAME              INSTALLED                FIXED-IN  VULNERABILITY     SEVERITY    SCANNERS
curl              7.74.0-1.3+deb11u7                 CVE-2023-23914    CRITICAL    grype(*), trivy(*)
curl              7.74.0-1.3+deb11u7                 CVE-2023-27536    CRITICAL    grype(*), trivy(*)
libcurl4          7.74.0-1.3+deb11u7                 CVE-2023-27536    CRITICAL    grype(*), trivy(*)
libdb5.3          5.3.28+dfsg1-0.8                   CVE-2019-8457     CRITICAL    grype(*), trivy(*)
libcurl4          7.74.0-1.3+deb11u7                 CVE-2023-23914    CRITICAL    grype(*), trivy(*)
perl-base         5.32.1-4+deb11u2                   CVE-2023-31484    HIGH        grype(*), trivy(*)
libss2            1.46.2-2                           CVE-2022-1304     HIGH        grype(*), trivy(*)
bash              5.1-2+deb11u1                      CVE-2022-3715     HIGH        grype(*), trivy(*)
Export results to KubeClarity backend
To export the CLI results to the KubeClarity backend, complete the following steps.
-
To export CLI-generated results to the backend, from the left menu bar select Applications, then copy the ID from the KubeClarity UI. If your application is not listed yet, select + New Application, and create a new pod.
-
To export the vulnerability scan results to the KubeClarity backend, set the BACKEND_HOST environment variable and the -e flag.
Note: Until TLS is supported, set BACKEND_DISABLE_TLS=true.
BACKEND_HOST=<KubeClarity backend address> BACKEND_DISABLE_TLS=true kubeclarity-cli scan <image> --application-id <application ID> -e
For example:
SCANNERS_LIST="grype" BACKEND_HOST=localhost:9999 BACKEND_DISABLE_TLS=true kubeclarity-cli scan nginx.sbom --input-type sbom --application-id 23452f9c-6e31-5845-bf53-6566b81a2906 -e
- Now you can see the exported results on the UI.
Check scan results on the UI
-
To see the results of a vulnerability scan, select the Vulnerabilities page in KubeClarity UI. It shows a report including the vulnerability names, severity, the package of origin, available fixes, and attribution to the scanner that reported the vulnerability.
-
You can click on any of these fields to access more in-depth information. For example, click on the name of a vulnerability in the VULNERABILITY NAME column.
-
Select CVSS to show the CVSS scores and other details reported from the scanning process.
-
Navigate back to the Vulnerabilities view to explore the filtering options. Filtering helps you reduce noise and improve efficiency in identifying and potentially fixing crucial vulnerabilities.
-
The KubeClarity Dashboard gives you insights into vulnerability trends and fixable vulnerabilities.
8.2.6.2 - Vulnerability scanning a local docker image
You can scan local docker images using the LOCAL_IMAGE_SCAN environment variable.
-
Generate the SBOM for your local docker image. For example:
LOCAL_IMAGE_SCAN=true kubeclarity-cli analyze nginx:latest -o nginx.sbom
-
Run the vulnerability scan on the output:
LOCAL_IMAGE_SCAN=true kubeclarity-cli scan nginx.sbom
8.2.6.3 - Remote scanner servers for CLI
When running the KubeClarity CLI to scan for vulnerabilities, the CLI needs to download the relevant vulnerability databases to the location where the KubeClarity CLI is running. Running the CLI in a CI/CD pipeline will result in downloading the databases on each run, wasting time and bandwidth. For this reason, several of the supported scanners have a remote mode in which a server is responsible for the database management and possibly scanning of the artifacts.
Note: The examples below are for each of the scanners, but they can be combined to run together the same as they can be in non-remote mode.
8.2.6.3.1 - Trivy
The Trivy scanner supports remote mode using the Trivy server. The Trivy server can be deployed as documented here: Trivy client-server mode.
Instructions to install the Trivy CLI are available here: Trivy install.
The Aqua team provides an official container image that can be used to run the server in Kubernetes or docker, which we’ll use in the examples.
-
Start the server:
docker run -p 8080:8080 --rm aquasec/trivy:0.41.0 server --listen 0.0.0.0:8080
-
Run a scan using the server:
SCANNERS_LIST="trivy" SCANNER_TRIVY_SERVER_ADDRESS="http://<trivy server address>:8080" ./kubeclarity_cli scan --input-type sbom nginx.sbom
Authentication
The Trivy server also provides token based authentication to prevent unauthorized use of a Trivy server instance. You can enable it by running the server with --token flag:
docker run -p 8080:8080 --rm aquasec/trivy:0.41.0 server --listen 0.0.0.0:8080 --token mytoken
Then pass the token to the scanner:
SCANNERS_LIST="trivy" SCANNER_TRIVY_SERVER_ADDRESS="http://<trivy server address>:8080" SCANNER_TRIVY_SERVER_TOKEN="mytoken" ./kubeclarity_cli scan --input-type sbom nginx.sbom
8.2.6.3.2 - Grype
Grype supports remote mode using grype-server, a RESTful grype wrapper which provides an API that receives an SBOM and returns the grype scan results for that SBOM. Grype-server ships as a container image, so can be run in Kubernetes or via Docker standalone.
-
Start the server:
docker run -p 9991:9991 --rm gcr.io/eticloud/k8sec/grype-server:v0.1.5
-
Run a scan using the server:
SCANNERS_LIST="grype" SCANNER_GRYPE_MODE="remote" SCANNER_REMOTE_GRYPE_SERVER_ADDRESS="<grype server address>:9991" SCANNER_REMOTE_GRYPE_SERVER_SCHEMES="https" ./kubeclarity_cli scan --input-type sbom nginx.sbom
If the grype server is deployed with TLS, you can override the default URL scheme like this:
SCANNERS_LIST="grype" SCANNER_GRYPE_MODE="remote" SCANNER_REMOTE_GRYPE_SERVER_ADDRESS="<grype server address>:9991" SCANNER_REMOTE_GRYPE_SERVER_SCHEMES="https" ./kubeclarity_cli scan --input-type sbom nginx.sbom
8.2.6.3.3 - Dependency track
Generate certificates
First generate a self-signed RSA key and certificate that the server can use for TLS.
openssl req -x509 -nodes -days 365 -newkey rsa:2048 -keyout /tmp/dt.key -out /tmp/dt.crt -subj "/CN=dependency-track-apiserver.dependency-track/O=dependency-track-apiserver.dependency-track"
Create a dependency-track application running in a Kubernetes cluster
-
Create a secret for ingress.
kubectl create ns dependency-track
kubectl create secret tls dtsecret --key /tmp/dt.key --cert /tmp/dt.crt -n dependency-track
-
Deploy nginx ingress controller
helm upgrade --install ingress-nginx ingress-nginx \
--repo https://kubernetes.github.io/ingress-nginx \
--namespace ingress-nginx --create-namespace
-
Deploy dependency-track.
helm repo add evryfs-oss https://evryfs.github.io/helm-charts/
helm install dependency-track evryfs-oss/dependency-track --namespace dependency-track --create-namespace -f values.yaml
kubectl apply -f dependency-track.ingress.yaml
-
Get dependency-track API server LoadBalancer IP
API_SERVICE_IP=$(kubectl get svc -n dependency-track dependency-track-apiserver -o jsonpath='{.status.loadBalancer.ingress[0].ip}')
echo $API_SERVICE_IP
34.69.242.184
-
Update API_BASE_URL environment variable in the values.yaml file with the $API_SERVICE_IP value.
For example, if the service IP is API_SERVICE_IP=34.69.242.184:
    - name: API_BASE_URL
      value: "http://34.69.242.184:80"
-
Upgrade dependency-track to include the new values.
helm upgrade dependency-track evryfs-oss/dependency-track --namespace dependency-track --create-namespace -f values.yaml
kubectl apply -f dependency-track.ingress.yaml
Get ingress LoadBalancer IP
INGRESSGATEWAY_SERVICE_IP=$(kubectl get svc -n ingress-nginx ingress-nginx-controller -o jsonpath='{.status.loadBalancer.ingress[0].ip}')
echo $INGRESSGATEWAY_SERVICE_IP
34.135.8.34
Add a DNS record
Add a DNS record into the /etc/hosts file for the NGINX loadblancer IP address. For example, for INGRESSGATEWAY_SERVICE_IP=34.135.8.34:
$ cat /etc/hosts
##
# Host Database
#
# localhost is used to configure the loopback interface
# when the system is booting.  Do not change this entry.
##
127.0.0.1	localhost
255.255.255.255	broadcasthost
::1             localhost
# Added by Docker Desktop
# To allow the same kube context to work on the host and the container:
127.0.0.1 kubernetes.docker.internal
# End of section
34.135.8.34 dependency-track-apiserver.dependency-track
Test with curl
curl -vvv -k https://dependency-track-apiserver.dependency-track/api/version
Do a test scan
-
Extract the API Key by completing the following steps.
kubectl -n dependency-track port-forward svc/dependency-track-frontend 7777:80 &- Open http://localhost:7777 in your browser. (Username/password is admin:admin)
- Navigate to Administration > Access Management > Teams and get an API Key.
-
Run a test scan. Replace XXX with your API key.
SCANNER_DEPENDENCY_TRACK_INSECURE_SKIP_VERIFY=true \
SCANNER_DEPENDENCY_TRACK_DISABLE_TLS=false \
SCANNER_DEPENDENCY_TRACK_HOST=dependency-track-apiserver.dependency-track \
SCANNER_DEPENDENCY_TRACK_API_KEY=XXX \
kubeclarity-ctl scan sbom.cyclonedx  -i sbom -o sbom-result.json
-
Create a port-forward (replace XXX with your API key).
kubectl --namespace dependency-track port-forward svc/dependency-track-apiserver 8081:80

SCANNER_DEPENDENCY_TRACK_DISABLE_TLS=true \
SCANNER_DEPENDENCY_TRACK_HOST=localhost:8081 \
SCANNER_DEPENDENCY_TRACK_API_KEY=XXX \
kubeclarity-ctl scan sbom.cyclonedx  -i sbom -o sbom-result.json
Cleanup
If you want to delete dependency-track and the related resources, run the following commands.
helm uninstall dependency-track -n dependency-track
helm uninstall ingress-nginx -n ingress-nginx
kubectl delete ns dependency-track ingress-nginx
8.2.7 - Private registry support
8.2.7.1 - Private registry support for the CLI
The KubeClarity CLI can read a configuration file that stores credentials for private registries. (For details, on using an external configuration file, see Set configuration file location for the CLI).
Example registry section of the configuration file:
registry:
  auths:
    - authority: <registry 1>
      username: <username for registry 1>
      password: <password for registry 1>
    - authority: <registry 2>
      token: <token for registry 2>
Example registry configuration without authority: (in this case these credentials will be used for all registries):
registry:
  auths:
    - username: <username>
      password: <password>
8.2.7.2 - Private registry support for Kubernetes
KubeClarity uses k8schain for authenticating to the registries. If the necessary service credentials are not discoverable by the k8schain, you can define them as secrets as described below.
In addition, if service credentials are not located in the kubeclarity namespace, set CREDS_SECRET_NAMESPACE to kubeclarity Deployment.
When using Helm charts, CREDS_SECRET_NAMESPACE is set to the release namespace installed kubeclarity.
Amazon ECR
-
Create an AWS IAM user with AmazonEC2ContainerRegistryFullAccess permissions.
-
Use the user credentials (AWS_ACCESS_KEY_ID, AWS_SECRET_ACCESS_KEY, AWS_DEFAULT_REGION) to create the following secret:
cat <<EOF | kubectl apply -f -
apiVersion: v1
kind: Secret
metadata:
  name: ecr-sa
  namespace: kubeclarity
type: Opaque
data:
  AWS_ACCESS_KEY_ID: $(echo -n 'XXXX'| base64 -w0)
  AWS_SECRET_ACCESS_KEY: $(echo -n 'XXXX'| base64 -w0)
  AWS_DEFAULT_REGION: $(echo -n 'XXXX'| base64 -w0)
EOF
Note:
- The name of the secret must be
ecr-sa - The secret data keys must be set to
AWS_ACCESS_KEY_ID, AWS_SECRET_ACCESS_KEY, and AWS_DEFAULT_REGION
Google GCR
-
Create a Google service account with Artifact Registry Reader permissions.
-
Use the service account json file to create the following secret:
kubectl --namespace kubeclarity create secret generic --from-file=sa.json gcr-sa
Note:
- Secret name must be
gcr-sa sa.json must be the name of the service account json file when generating the secret- KubeClarity is using application default credentials. These only work when running KubeClarity from GCP.
8.2.8 - Set configuration file location for the CLI
The default configuration path of the CLI is $HOME/.kubeclarity. To specify a different file, use the --config flag, like this:
kubeclarity-cli <scan/analyze> <image name> --config <kubeclarity config path>
For example:
kubeclarity-cli scan registry/nginx:private --config $HOME/own-kubeclarity-config
8.2.9 - Merge scan results
You can merge SBOM and vulnerabilities scan results into a single file. For example, you can merge the scan results across different CI/CD stages.
To merge an existing SBOM into the final results, use the --merge-sbom <existing-sbom-file> flag during analysis. The input SBOM can be in CycloneDX XML or CyclonDX JSON format. (For details on output formats, see SBOM output format).
For example:
ANALYZER_LIST="syft" kubeclarity-cli analyze nginx:latest -o nginx.sbom --merge-sbom inputsbom.xml
8.2.10 - KubeClarity development
Building KubeClarity
make build will build all of the KubeClarity code and UI.
Makefile targets are provided to compile and build the KubeClarity binaries.
make build-all-go can be used to build all of the go components, but also
specific targets are provided, for example make cli and make backend to
build the specific components in isolation.
make ui is provided to just build the UI components.
Building KubeClarity Containers
make docker can be used to build the KubeClarity containers for all of the
components. Specific targets for example make docker-cli and make docker-backend are also provided.
make push-docker is also provided as a shortcut for building and then
publishing the KubeClarity containers to a registry. You can override the
destination registry like:
DOCKER_REGISTRY=docker.io/tehsmash make push-docker
You must be logged into the docker registry locally before using this target.
Linting
make lint can be used to run the required linting rules over the code.
golangci-lint rules and config can be viewed in the .golangcilint file in the
root of the repo.
make fix is also provided which will resolve lint issues which are
automaticlly fixable for example format issues.
make license can be used to validate that all the files in the repo have the
correctly formatted license header.
Unit tests
make test can be used run all the unit tests in the repo. Alternatively you
can use the standard go test CLI to run a specific package or test by going
into a specific modules directory and running:
cd cli
go test ./cmd/... -run <test name regex>
Generating API code
After making changes to the API schema for example api/swagger.yaml, you can run make api to regenerate the model, client and server code.
Testing End to End
End to end tests will start and exercise a KubeClarity running on the local
container runtime. This can be used locally or in CI. These tests ensure that
more complex flows such as the CLI exporting results to the API work as
expected.
Note:
If running Docker Desktop for Mac you will need to increase docker daemon
memory to 8G. Careful, this will drain a lot from your computer cpu.
In order to run end-to-end tests locally:
# Build all docker images
make docker
# Replace Values In The KubeClarity Chart:
sed -i 's/latest/${{ github.sha }}/g' charts/kubeclarity/values.yaml
sed -i 's/Always/IfNotPresent/g' charts/kubeclarity/values.yaml
# Build the KubeClarity CLI
make cli
# Move the Built CLI into the E2E Test folder
mv ./cli/bin/cli ./e2e/kubeclarity-cli
# Run the end to end tests
make e2e
Sending Pull Requests
Before sending a new pull request, take a look at existing pull requests and issues to see if the proposed change or fix
has been discussed in the past, or if the change was already implemented but not yet released.
We expect new pull requests to include tests for any affected behavior, and, as we follow semantic versioning, we may
reserve breaking changes until the next major version release.
8.3 - APIClarity
APIClarity, an open source cloud native visibility tool for APIs, uses a Service Mesh framework to capture and analyze API traffic, and identify potential risks.
Use APIClarity to compare your OpenAPI specification to its state at runtime. For apps that don’t have an OpenAPI specification, APIClarity can reconstruct a specification in a live environment.
Cloud native applications use and expose APIs, which have been the source of many highly publicized cyber-attacks and breaches. APIClarity improves your API visibility and your applications security posture.
APIClarity is the tool responsible for API Security in the OpenClarity platform.
Why APIClarity?
- Quick and Easy API Visibility and Analysis: Reduce API security risk without code instrumentation or workload modification.
- Comprehensive Dashboard to Monitor APIs: Evaluate OpenAPI specifications for security issues and best practices. Where there is no spec, automatically generate one.
- Designed for Developers, Loved by Security: Detect Zombie and Shadow APIs, alert users on risks, identify changes between approved OpenAPI specs and APIs at runtime.
Challenges for API microservices
Microservice applications interact via API’s with many other applications. To minimize risk, it is valuable to have visibility to the OpenAPI specifications and to understand any potential changes to that specification throughout the application lifecycle. However, obtaining OpenAPI specs can be challenging, particularly for external or legacy applications.
Proper OpenAPI specifications can be further complicated by microservices that use deprecated APIs (a.k.a. Zombie APIs) or microservices that use undocumented APIs (a.k.a. Shadow APIs).
Finally, it’s important to be able to obtain Open API specifications without code instrumentation or modifying existing workloads.
- Not all applications have their Open API specification available.
- How can we get this for our legacy or external applications?
- Ability to detect that microservices still use deprecated APIs (a.k.a. Zombie APIs)
- Ability to detect that microservices use undocumented APIs (a.k.a. Shadow APIs)
- Ability to get Open API specifications without code instrumentation or modifying existing workloads (seamless documentation)
How does APIClarity overcome these challenges?
- Capture all API traffic in an existing environment using a service-mesh framework
- Construct the Open API specification by observing the API traffic
- Allow the User to upload Open API spec, review, modify and approve generated Open API specs
- Alert the user on any difference between the approved API specification and the one that is observed in runtime, detects shadow & zombie APIs
- UI dashboard to audit and monitor the API findings
Overview
High-level architecture
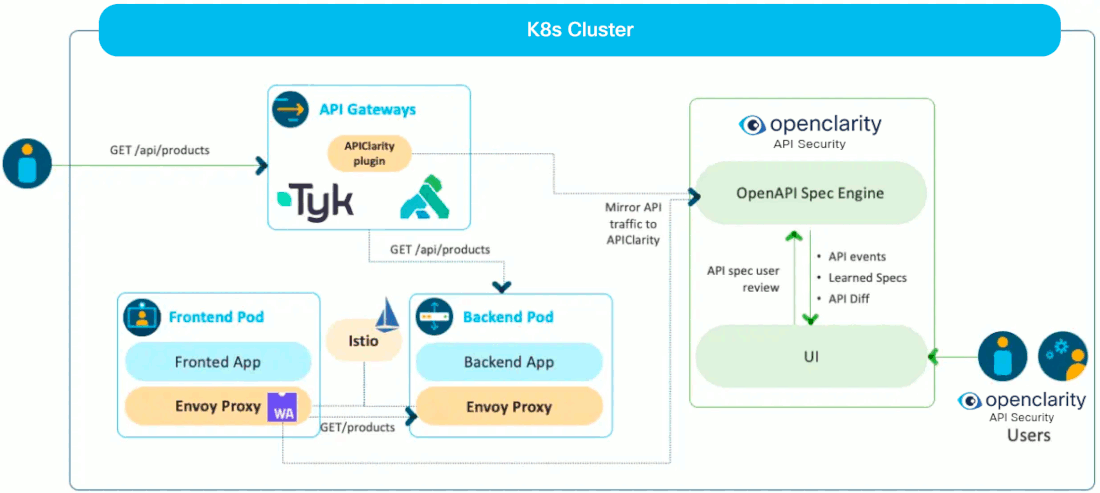
8.3.1 - Features
APIClarity is a modular tool that addresses several aspects of API Security, focusing specifically on OpenAPI based APIs.
APIClarity approaches API Security in 2 different ways:
- Captures all API traffic in a given environment and performs a set of security analysis to discover all potential security problems with detected APIs
- Actively tests API endpoints to detect security issues in the implementation of such APIs.
OpenAPI automatic reconstruction
Both approaches described above are way more effective when APIClarity is primed with the OpenAPI specifications of the APIs analyzed or tested. However, not all applications have an OpenAPI specification available. For this reason one of the main functionality of APIClarity is the automatic reconstruction of OpenAPI specifications based on observed API traffic. In this case, users have the ability to review and approve the reconstructed specifications.
Security Modules
APIClarity is structured in a modular architecture, which allows to easily add new functionalities. The following modules are currently implemented:
-
Spec Diffs This module compares the API traces with the OAPI specifications provided by the user or previously reconstructed. The result of this comparison provides:
- List of API endpoints that are observed but not documented in the specs, i.e. Shadow APIs;
- List of API endpoints that are observed but marked as deprecated in the specs, i.e. Zombie APIs;
- List of difference between of the APIs observed and their documented specification.
-
Trace Analyzer This module analyzes path, headers and body of API requests and responses to discover potential security issues, such as weak authentications, exposure of sensitive information, potential Broken Object Level Authorizations (BOLA) etc.
-
BFLA Detector This module detects potential Broken Function Level Authorization. In particular it observes the API interactions and build an authorization model that captures what clients are supposed to be authorized to make the various API calls. Based on such authorization model it then signals violations which may represent potential issues in the API authorization procedures.
-
Fuzzer This module actively tests API endpoints based on their specification attempting in discovering security issues in the API server implementation.
Supported traffic source integrations
APIClarity supports integrating with the following traffic sources. Install APIClarity and follow the instructions per required integration.
The integrations (plugins) for the supported traffic sources above are located in the plugins directory within the codebase and implement in the plugins API to export the API events to APIClarity.
To enable and configure the supported traffic sources, see the trafficSource: section in Helm values.
Contributions that integrate additional traffic sources are more than welcome!
8.3.2 - Getting started
This chapter shows you how to install APIClarity, and guides you through the most common tasks that you can perform with APIClarity.
8.3.2.1 - Install APIClarity
Install APIClarity in a K8s cluster using Helm
-
Add the Helm repository.
helm repo add apiclarity https://openclarity.github.io/apiclarity
-
Save the default chart values into the values.yaml file.
helm show values apiclarity/apiclarity > values.yaml
Note: The file values.yaml is used to deploy and configure APIClarity on your cluster via Helm. This ConfigMap is used to define the list of headers to ignore when reconstructing the spec.
-
Update values.yaml with the required traffic source values.
-
Deploy APIClarity with Helm.
helm install --values values.yaml --create-namespace apiclarity apiclarity/apiclarity --namespace apiclarity
-
Port forward to the APIClarity UI:
kubectl port-forward --namespace apiclarity svc/apiclarity-apiclarity 9999:8080
-
Open the APIClarity UI in your browser at http://localhost:9999/
-
Generate some traffic in the traced applications, for example, using a demo application.
-
Check the APIClarity UI.
Uninstall APIClarity from Kubernetes using Helm
-
Uninstall the Helm deployment.
helm uninstall apiclarity --namespace apiclarity
-
Clean the resources. By default, Helm will not remove the PVCs and PVs for the StatefulSets. Run the following command to delete them all:
kubectl delete pvc -l app.kubernetes.io/instance=apiclarity --namespace apiclarity
Build from source
-
Build and push the image to your repo:
DOCKER_IMAGE=<your docker registry>/apiclarity DOCKER_TAG=<your tag> make push-docker
-
Update values.yaml accordingly.
Run locally with demo data
-
Build the UI and the backend locally.
-
Copy the built site:
-
Run the backend and frontend locally using demo data:
Note: You might need to delete the old local state file and local db:
DATABASE_DRIVER=LOCAL K8S_LOCAL=true FAKE_TRACES=true FAKE_TRACES_PATH=./backend/pkg/test/trace_files \
ENABLE_DB_INFO_LOGS=true ./backend/bin/backend run
Note: this command requires a proper KUBECONFIG in your environment when K8S_LOCAL=true is used. If you want to run without Kubernetes, use ENABLE_K8S=false instead.
-
Open the APIClarity UI in your browser at: http://localhost:8080/
8.3.2.2 - Install demo application
If you want to use a demo application to try APIClarity, you can use the Sock Shop Demo. To deploy the Sock Shop Demo, complete the following steps.
-
Create the sock-shop namespace and enable Istio injection.
kubectl create namespace sock-shop
kubectl label namespaces sock-shop istio-injection=enabled
-
Deploy the Sock Shop Demo to your cluster.
kubectl apply -f https://raw.githubusercontent.com/microservices-demo/microservices-demo/master/deploy/kubernetes/complete-demo.yaml
-
Deploy APIClarity in the sock-shop namespace (with the Istio service-mesh traffic source):
helm repo add apiclarity https://openclarity.github.io/apiclarity
helm install --set 'trafficSource.envoyWasm.enabled=true' --set 'trafficSource.envoyWasm.namespaces={sock-shop}' --create-namespace apiclarity apiclarity/apiclarity --namespace apiclarity
-
Port forward to Sock Shop’s front-end service to access the Sock Shop Demo App:
kubectl port-forward -n sock-shop svc/front-end 7777:80
-
Open the Sock Shop Demo App UI in your browser at http://localhost:7777/ and run some transactions to generate data to review on the APIClarity dashboard.
8.3.3 - Enable external trace sources support
If you enable external trace sources support, APIClarity can receive the trace sources from the entities that are external to the Kubernetes cluster. External trace sources such as Gateways and Load balancers can communicate with APIClarity to report APIs and send the traces.
Supported Trace Sources
APIClarity can support with the following trace sources and follow the instructions per required integration.
- Apigee X Gateway
- BIG-IP LTM Load balancer
- Kong
- Tyk
Deploy APIClarity with support for external trace sources
-
Add Helm Repo
helm repo add apiclarity https://openclarity.github.io/apiclarity
-
Update values.yaml with:
Apiclarity -> tls -> enabled as true
supportExternalTraceSource -> enabled as true
-
Deploy APIClarity with the updated values.yaml to enable external traffic sources.
helm install --values values.yaml --create-namespace apiclarity apiclarity/apiclarity -n apiclarity
-
Port forward to the APIClarity UI:
kubectl port-forward -n apiclarity svc/apiclarity-apiclarity 9999:8080
-
Open the APIClarity UI in your browser at http://localhost:9999
Register a new external trace source
This section shows you how to access the service, register a new trace source, and how to receive the token and certificate. The examples use the Apigee X Gateway as the external trace source.
-
Port forward for service at 8443.
kubectl port-forward -n apiclarity svc/apiclarity-apiclarity 8443:8443
-
Register a new external trace source and receive the token.
TRACE_SOURCE_TOKEN=$(curl --http1.1 --insecure -s -H 'Content-Type: application/json' -d '{"name":"apigee_gateway","type":"APIGEE_X"}' https://localhost:8443/api/control/traceSources|jq -r '.token')
-
Get the External-IP for the apiclarity-external service.
kubectl get services --namespace apiclarity
-
Use the External-IP address with the following command, then extract the certificate between -----BEGIN CERTIFICATE----- and -----END CERTIFICATE----- and save it to the server.crt file.
openssl s_client -showcerts -connect <External-IP>:10443
-
If you want to configure other trace sources, use the extracted token in Step 2 and the certificate in Step 3.
8.3.4 - API reference
8.3.4.1 - Core API reference
8.3.4.2 - Common API reference
9 - Support
If you encounter problems while using OpenClarity that the documentation does not address, you can open an issue in the repository of the relevant component or talk to us on Slack.
Before reporting a new issue, please ensure that the issue was not already reported or fixed by searching through our issue tracker.
When creating a new issue, please be sure to include a title and clear description, as much relevant information as possible, and, if possible, a test case.
If you discover a security bug, please do not report it through GitHub issues. Instead, please follow the steps in Security procedures.
10 -
How to Contribute
Thanks for your interest in contributing to OpenClarity! Here are a few general guidelines on contributing and
reporting bugs that we ask you to review. Following these guidelines helps to communicate that you respect the time of
the contributors managing and developing this open source project. In return, they should reciprocate that respect in
addressing your issue, assessing changes, and helping you finalize your pull requests. In that spirit of mutual respect,
we endeavor to review incoming issues and pull requests within 10 days, and will close any lingering issues or pull
requests after 60 days of inactivity.
Please note that all of your interactions in the project are subject to our Code of Conduct. This
includes creation of issues or pull requests, commenting on issues or pull requests, and extends to all interactions in
any real-time space e.g., Slack, Discord, etc.
Table Of Contents
Reporting Issues
Before reporting a new issue, please ensure that the issue was not already reported or fixed by searching through our
issues list.
When creating a new issue, please be sure to include a title and clear description, as much relevant information as
possible, and, if possible, a test case.
If you discover a security bug, please do not report it through GitHub. Instead, please see security procedures in
SECURITY.md.
Development
After cloning the repository, you can run make help to inspect the targets that are used for checking, generating,
building, and publishing code.
Dependencies
Docker (for local and e2e testing)Go for the backend (the current version used by the project can be found in the .go-version file)- A Node package manager for the frontend, such as
npm or yarn
Internal dependencies by make targets are automatically installed if not present locally.
Development Environment
Depending on your IDE/editor of choice, you might need a go.work file for the gopls language server to find all
references properly, such as:
go 1.22.6

use (
  ./api/client
  ./api/server
  ./api/types
  ./cli
  ./containerruntimediscovery/client
  ./containerruntimediscovery/server
  ./containerruntimediscovery/types
  ./core
  ./e2e
  ./e2e/testdata
  ./installation
  ./orchestrator
  ./provider
  ./plugins/runner
  ./plugins/sdk-go
  ./plugins/sdk-go/example
  ./plugins/store/kics
  ./scanner
  ./testenv
  ./uibackend/client
  ./uibackend/server
  ./uibackend/types
  ./utils
  ./workflow
)
Running the OpenClarity stack locally using Docker
For testing the changes across the whole stack, OpenClarity can be ran with Docker provider locally, after the images have
been built and their tags have been updated in the
installation/docker/image_override.env file:
docker compose --project-name openclarity \
               --file installation/docker/docker-compose.yml \
               --env-file installation/docker/image_override.env \
               up -d --wait --remove-orphans
When working only on one stack component, the component in question can be commented out in the docker compose
file and ran separately with go run, or in the case of the UI, with the
following commands:
make ui-dev to create UI development environment.
Alternatively you can run them separately with:
make ui-install can be used to install the UI dependencies.make ui-start can be used to start the UI development server.
Update the NGINX config accordingly if the components in question are affected to
ensure that Docker can communicate with them if they are ran on local network.
Some environment variables could also be necessary for you to export in your shell before running the component, inspect
the contents of the corresponding .env file in the installation/docker directory!
To clean up the OpenClarity stack locally, run:
docker compose --project-name openclarity \
               --file installation/docker/docker-compose.yml \
               down --remove-orphans --volumes
Building OpenClarity Binaries
Makefile targets are provided to compile and build the OpenClarity binaries. make build can be used to build all the
components, while make build-all-go and make ui only builds the go modules or the UI.
Building OpenClarity Containers
make docker can be used to build the OpenClarity containers for all the components. Specific targets for example make docker-cli and make docker-ui-backend are also provided.
In order to also publish the OpenClarity containers to a registry, please set the DOCKER_PUSH environment variable to
true. You can override the destination registry as well:
DOCKER_REGISTRY=docker.io/my-openclarity-images DOCKER_PUSH=true make docker
You must be logged into the docker registry locally before using this target.
Linting
make lint can be used to run all the required linting rules over the code. In this case, the following targets will be
ran:
make license-check can be used to validate that all the files in the repo have the correctly formatted license
header.make lint-actions checks Github Actions workflow files.make lint-bicep lints Bicep files.make lint-cfn lints Cloudformation files.make lint-go runs golangci-lint on the Go files. Rules and config can be viewed in the .golangci.yml file in the
root of the repo.make lint-js runs npm run lint on the frontend files. Rules and config can be viewed in the ui/.eslintrc file.make lint-helm lints the Helm chart.
make fix is also provided which can automatically resolve lint issues such as formatting.
Unit tests
make test to run both go and js unit tests.
Alternatively you can run them separately with:
make test-go can be used run all go unit tests in the repo. Alternatively you
can use the standard go test CLI to run a specific package or test like:
go test ./cli/cmd/... -run Test_isSupportedFS
make test-js can be used to run all js unit tests in the repo.
Generators
make gen runs the following targets that can be ran separately as well:
- After making changes to the API schema in
api/openapi.yaml, you can run make gen-api-go and make gen-api-js to regenerate the models,
client and server code. - Run
make gen-bicep for generating bicep files after modifying them for installing OpenClarity on Azure. - Run
make gen-helm-docs for generating the docs after making changes to OpenClarity’s Helm chart.
Prettier is enabled (so you can use autoformatting plugins), and its use is enforced for files under the ui/
directory. For example you could use something similar in VSCode’s settings.json:
}
  "[javascriptreact]": {
    "editor.formatOnSave": true,
    "editor.formatOnType": true,
    "editor.defaultFormatter": "esbenp.prettier-vscode"
  },
  ...
}
make format can be used to format everything at once with Prettier which is also being checked by the CI.
Testing End to End
make e2e-docker can be used run the end-to-end tests in the repository locally using Docker. make e2e-k8s can also
be used to run end-to-end tests for Kubernetes provider using Docker.
For details on how to test OpenClarity, please check the testing guide here on how to perform a test
on AWS and the instructions here on how to run and add new tests.
Troubleshooting and Debugging
Please see the troubleshooting and debugging guide here.
Sending Pull Requests
Before sending a new pull request, take a look at existing pull requests and issues to see if the proposed change or fix
has been discussed in the past, or if the change was already implemented but not yet released.
We expect new pull requests to include tests for any affected behavior, and, as we follow semantic versioning, we may
reserve breaking changes until the next major version release.
Other Ways to Contribute
We welcome anyone that wants to contribute to OpenClarity to triage and reply to open issues to help troubleshoot
and fix existing bugs. Here is what you can do:
- Help ensure that existing issues follows the recommendations from the Reporting Issues section,
providing feedback to the issue’s author on what might be missing.
- Review and update the existing content of our Wiki with up-to-date
instructions and code samples.
- Review existing pull requests, and testing patches against real existing applications that use OpenClarity.
- Write a test, or add a missing test case to an existing test.
Thanks again for your interest on contributing to OpenClarity!
:heart:
11 - Security Policies and Procedures
This document outlines security procedures and general policies for the
OpenClarity project.
Reporting a Bug
The OpenClarity team and community take all security bugs in
OpenClarity seriously. Thank you for improving the security of
OpenClarity. We appreciate your efforts and responsible disclosure and
will make every effort to acknowledge your contributions.
Report security bugs by emailing oss-security@cisco.com.
The lead maintainer will acknowledge your email within 48 hours, and will send a
more detailed response within 48 hours indicating the next steps in handling
your report. After the initial reply to your report, the security team will
endeavor to keep you informed of the progress towards a fix and full
announcement, and may ask for additional information or guidance.
Disclosure Policy
When the security team receives a security bug report, they will assign it to a
primary handler. This person will coordinate the fix and release process,
involving the following steps:
- Confirm the problem and determine the affected versions.
- Audit code to find any potential similar problems.
- Prepare fixes for all releases still under maintenance. These fixes will be
released as quickly as possible.
If you have suggestions on how this process could be improved please submit a
pull request.
12 - Contributor Covenant Code of Conduct
Our Pledge
In the interest of fostering an open and welcoming environment, we as
contributors and maintainers pledge to make participation in our project and
our community a harassment-free experience for everyone, regardless of age, body
size, disability, ethnicity, sex characteristics, gender identity and expression,
level of experience, education, socio-economic status, nationality, personal
appearance, race, religion, or sexual identity and orientation.
Our Standards
Examples of behavior that contributes to creating a positive environment
include:
- Using welcoming and inclusive language.
- Being respectful of differing viewpoints and experiences.
- Gracefully accepting constructive criticism.
- Focusing on what is best for the community.
- Showing empathy towards other community members.
Examples of unacceptable behavior by participants include:
- The use of sexualized language or imagery and unwelcome sexual attention or
advances.
- Trolling, insulting/derogatory comments, and personal or political attacks.
- Public or private harassment.
- Publishing others’ private information, such as a physical or electronic
address, without explicit permission.
- Other conduct which could reasonably be considered inappropriate in a
professional setting.
Our Responsibilities
Project maintainers are responsible for clarifying the standards of acceptable
behavior and are expected to take appropriate and fair corrective action in
response to any instances of unacceptable behavior.
Project maintainers have the right and responsibility to remove, edit, or
reject comments, commits, code, wiki edits, issues, and other contributions
that are not aligned to this Code of Conduct, or to ban temporarily or
permanently any contributor for other behaviors that they deem inappropriate,
threatening, offensive, or harmful.
Scope
This Code of Conduct applies within all project spaces, and it also applies when
an individual is representing the project or its community in public spaces.
Examples of representing a project or community include using an official
project e-mail address, posting via an official social media account, or acting
as an appointed representative at an online or offline event. Representation of
a project may be further defined and clarified by project maintainers.
Enforcement
Instances of abusive, harassing, or otherwise unacceptable behavior may be
reported by contacting the project team at oss-conduct@cisco.com. All
complaints will be reviewed and investigated and will result in a response that
is deemed necessary and appropriate to the circumstances. The project team is
obligated to maintain confidentiality with regard to the reporter of an incident.
Further details of specific enforcement policies may be posted separately.
Project maintainers who do not follow or enforce the Code of Conduct in good
faith may face temporary or permanent repercussions as determined by other
members of the project’s leadership.
Attribution
This Code of Conduct is adapted from the Contributor Covenant, version 1.4,
available at https://www.contributor-covenant.org/version/1/4/code-of-conduct.html.
For answers to common questions about this code of conduct, see
https://www.contributor-covenant.org/faq.
13 - Community
If you have questions about the OpenClarity platform or its components, get in touch with us on Slack!
First, register on the Outshift Slack, then visit our Slack channel.
If you’d like to contribute, see our contribution guidelines for details.
14 -
                             Apache License
                       Version 2.0, January 2004
                    http://www.apache.org/licenses/
TERMS AND CONDITIONS FOR USE, REPRODUCTION, AND DISTRIBUTION
-
Definitions.
“License” shall mean the terms and conditions for use, reproduction,
and distribution as defined by Sections 1 through 9 of this document.
“Licensor” shall mean the copyright owner or entity authorized by
the copyright owner that is granting the License.
“Legal Entity” shall mean the union of the acting entity and all
other entities that control, are controlled by, or are under common
control with that entity. For the purposes of this definition,
“control” means (i) the power, direct or indirect, to cause the
direction or management of such entity, whether by contract or
otherwise, or (ii) ownership of fifty percent (50%) or more of the
outstanding shares, or (iii) beneficial ownership of such entity.
“You” (or “Your”) shall mean an individual or Legal Entity
exercising permissions granted by this License.
“Source” form shall mean the preferred form for making modifications,
including but not limited to software source code, documentation
source, and configuration files.
“Object” form shall mean any form resulting from mechanical
transformation or translation of a Source form, including but
not limited to compiled object code, generated documentation,
and conversions to other media types.
“Work” shall mean the work of authorship, whether in Source or
Object form, made available under the License, as indicated by a
copyright notice that is included in or attached to the work
(an example is provided in the Appendix below).
“Derivative Works” shall mean any work, whether in Source or Object
form, that is based on (or derived from) the Work and for which the
editorial revisions, annotations, elaborations, or other modifications
represent, as a whole, an original work of authorship. For the purposes
of this License, Derivative Works shall not include works that remain
separable from, or merely link (or bind by name) to the interfaces of,
the Work and Derivative Works thereof.
“Contribution” shall mean any work of authorship, including
the original version of the Work and any modifications or additions
to that Work or Derivative Works thereof, that is intentionally
submitted to Licensor for inclusion in the Work by the copyright owner
or by an individual or Legal Entity authorized to submit on behalf of
the copyright owner. For the purposes of this definition, “submitted”
means any form of electronic, verbal, or written communication sent
to the Licensor or its representatives, including but not limited to
communication on electronic mailing lists, source code control systems,
and issue tracking systems that are managed by, or on behalf of, the
Licensor for the purpose of discussing and improving the Work, but
excluding communication that is conspicuously marked or otherwise
designated in writing by the copyright owner as “Not a Contribution.”
“Contributor” shall mean Licensor and any individual or Legal Entity
on behalf of whom a Contribution has been received by Licensor and
subsequently incorporated within the Work.
-
Grant of Copyright License. Subject to the terms and conditions of
this License, each Contributor hereby grants to You a perpetual,
worldwide, non-exclusive, no-charge, royalty-free, irrevocable
copyright license to reproduce, prepare Derivative Works of,
publicly display, publicly perform, sublicense, and distribute the
Work and such Derivative Works in Source or Object form.
-
Grant of Patent License. Subject to the terms and conditions of
this License, each Contributor hereby grants to You a perpetual,
worldwide, non-exclusive, no-charge, royalty-free, irrevocable
(except as stated in this section) patent license to make, have made,
use, offer to sell, sell, import, and otherwise transfer the Work,
where such license applies only to those patent claims licensable
by such Contributor that are necessarily infringed by their
Contribution(s) alone or by combination of their Contribution(s)
with the Work to which such Contribution(s) was submitted. If You
institute patent litigation against any entity (including a
cross-claim or counterclaim in a lawsuit) alleging that the Work
or a Contribution incorporated within the Work constitutes direct
or contributory patent infringement, then any patent licenses
granted to You under this License for that Work shall terminate
as of the date such litigation is filed.
-
Redistribution. You may reproduce and distribute copies of the
Work or Derivative Works thereof in any medium, with or without
modifications, and in Source or Object form, provided that You
meet the following conditions:
(a) You must give any other recipients of the Work or
Derivative Works a copy of this License; and
(b) You must cause any modified files to carry prominent notices
stating that You changed the files; and
(c) You must retain, in the Source form of any Derivative Works
that You distribute, all copyright, patent, trademark, and
attribution notices from the Source form of the Work,
excluding those notices that do not pertain to any part of
the Derivative Works; and
(d) If the Work includes a “NOTICE” text file as part of its
distribution, then any Derivative Works that You distribute must
include a readable copy of the attribution notices contained
within such NOTICE file, excluding those notices that do not
pertain to any part of the Derivative Works, in at least one
of the following places: within a NOTICE text file distributed
as part of the Derivative Works; within the Source form or
documentation, if provided along with the Derivative Works; or,
within a display generated by the Derivative Works, if and
wherever such third-party notices normally appear. The contents
of the NOTICE file are for informational purposes only and
do not modify the License. You may add Your own attribution
notices within Derivative Works that You distribute, alongside
or as an addendum to the NOTICE text from the Work, provided
that such additional attribution notices cannot be construed
as modifying the License.
You may add Your own copyright statement to Your modifications and
may provide additional or different license terms and conditions
for use, reproduction, or distribution of Your modifications, or
for any such Derivative Works as a whole, provided Your use,
reproduction, and distribution of the Work otherwise complies with
the conditions stated in this License.
-
Submission of Contributions. Unless You explicitly state otherwise,
any Contribution intentionally submitted for inclusion in the Work
by You to the Licensor shall be under the terms and conditions of
this License, without any additional terms or conditions.
Notwithstanding the above, nothing herein shall supersede or modify
the terms of any separate license agreement you may have executed
with Licensor regarding such Contributions.
-
Trademarks. This License does not grant permission to use the trade
names, trademarks, service marks, or product names of the Licensor,
except as required for reasonable and customary use in describing the
origin of the Work and reproducing the content of the NOTICE file.
-
Disclaimer of Warranty. Unless required by applicable law or
agreed to in writing, Licensor provides the Work (and each
Contributor provides its Contributions) on an “AS IS” BASIS,
WITHOUT WARRANTIES OR CONDITIONS OF ANY KIND, either express or
implied, including, without limitation, any warranties or conditions
of TITLE, NON-INFRINGEMENT, MERCHANTABILITY, or FITNESS FOR A
PARTICULAR PURPOSE. You are solely responsible for determining the
appropriateness of using or redistributing the Work and assume any
risks associated with Your exercise of permissions under this License.
-
Limitation of Liability. In no event and under no legal theory,
whether in tort (including negligence), contract, or otherwise,
unless required by applicable law (such as deliberate and grossly
negligent acts) or agreed to in writing, shall any Contributor be
liable to You for damages, including any direct, indirect, special,
incidental, or consequential damages of any character arising as a
result of this License or out of the use or inability to use the
Work (including but not limited to damages for loss of goodwill,
work stoppage, computer failure or malfunction, or any and all
other commercial damages or losses), even if such Contributor
has been advised of the possibility of such damages.
-
Accepting Warranty or Additional Liability. While redistributing
the Work or Derivative Works thereof, You may choose to offer,
and charge a fee for, acceptance of support, warranty, indemnity,
or other liability obligations and/or rights consistent with this
License. However, in accepting such obligations, You may act only
on Your own behalf and on Your sole responsibility, not on behalf
of any other Contributor, and only if You agree to indemnify,
defend, and hold each Contributor harmless for any liability
incurred by, or claims asserted against, such Contributor by reason
of your accepting any such warranty or additional liability.
END OF TERMS AND CONDITIONS
APPENDIX: How to apply the Apache License to your work.
  To apply the Apache License to your work, attach the following
  boilerplate notice, with the fields enclosed by brackets "[]"
  replaced with your own identifying information. (Don't include
  the brackets!)  The text should be enclosed in the appropriate
  comment syntax for the file format. We also recommend that a
  file or class name and description of purpose be included on the
  same "printed page" as the copyright notice for easier
  identification within third-party archives.
Copyright 2024 Cisco Systems, Inc. and its affiliates
Licensed under the Apache License, Version 2.0 (the “License”);
you may not use this file except in compliance with the License.
You may obtain a copy of the License at
http://www.apache.org/licenses/LICENSE-2.0
Unless required by applicable law or agreed to in writing, software
distributed under the License is distributed on an “AS IS” BASIS,
WITHOUT WARRANTIES OR CONDITIONS OF ANY KIND, either express or implied.
See the License for the specific language governing permissions and
limitations under the License.