This is the multi-page printable view of this section.
Click here to print.
Return to the regular view of this page.
Kubernetes Security
KubeClarity is a tool for detection and management of Software Bill Of Materials (SBOM) and vulnerabilities of container images and filesystems. It scans both runtime K8s clusters and CI/CD pipelines for enhanced software supply chain security.
KubeClarity is the tool responsible for Kubernetes Security in the OpenClarity platform.

Why?
SBOM & Vulnerability Detection Challenges
- Effective vulnerability scanning requires an accurate Software Bill Of Materials (SBOM) detection:
- Various programming languages and package managers
- Various OS distributions
- Package dependency information is usually stripped upon build
- Which one is the best scanner/SBOM analyzer?
- What should we scan: Git repos, builds, container images or runtime?
- Each scanner/analyzer has its own format - how to compare the results?
- How to manage the discovered SBOM and vulnerabilities?
- How are my applications affected by a newly discovered vulnerability?
Solution
- Separate vulnerability scanning into 2 phases:
- Content analysis to generate SBOM
- Scan the SBOM for vulnerabilities
- Create a pluggable infrastructure to:
- Run several content analyzers in parallel
- Run several vulnerability scanners in parallel
- Scan and merge results between different CI stages using KubeClarity CLI
- Runtime K8s scan to detect vulnerabilities discovered post-deployment
- Group scanned resources (images/directories) under defined applications to navigate the object tree dependencies (applications, resources, packages, vulnerabilities)
Architecture

Limitations
- Supports Docker Image Manifest V2, Schema 2 (https://docs.docker.com/registry/spec/manifest-v2-2/). It will fail to scan earlier versions.
Roadmap
- Integration with additional content analyzers (SBOM generators)
- Integration with additional vulnerability scanners
- CIS Docker benchmark in UI
- Image signing using Cosign
- CI/CD metadata signing and attestation using Cosign and in-toto (supply chain security)
- System settings and user management
1 - Features
- Dashboard
- Fixable vulnerabilities per severity
- Top 5 vulnerable elements (applications, resources, packages)
- New vulnerabilities trends
- Package count per license type
- Package count per programming language
- General counters
- Applications
- Automatic application detection in K8s runtime
- Create/edit/delete applications
- Per application, navigation to related:
- Resources (images/directories)
- Packages
- Vulnerabilities
- Licenses in use by the resources
- Application Resources (images/directories)
- Per resource, navigation to related:
- Applications
- Packages
- Vulnerabilities
- Packages
- Per package, navigation to related:
- Applications
- Linkable list of resources and the detecting SBOM analyzers
- Vulnerabilities
- Vulnerabilities
- Per vulnerability, navigation to related:
- Applications
- Resources
- List of detecting scanners
- K8s Runtime scan
- On-demand or scheduled scanning
- Automatic detection of target namespaces
- Scan progress and result navigation per affected element (applications, resources, packages, vulnerabilities)
- CIS Docker benchmark
- CLI (CI/CD)
- SBOM generation using multiple integrated content analyzers (Syft, cyclonedx-gomod)
- SBOM/image/directory vulnerability scanning using multiple integrated scanners (Grype, Dependency-track)
- Merging of SBOM and vulnerabilities across different CI/CD stages
- Export results to KubeClarity backend
- API
Integrated SBOM generators and vulnerability scanners
KubeClarity content analyzer integrates with the following SBOM generators:
KubeClarity vulnerability scanner integrates with the following scanners:
2 - Concepts and background
The following sections give you the concepts and background information about the scans provided by KubeClarity.
2.1 - Software bill of materials
A software bill of materials (SBOM) is a list of all the components, libraries, and other dependencies that make up a software application, along with information about the versions, licenses, and vulnerabilities associated with each component. They are formal, structured documents detailing the components of a software product and its supply chain relationships.
SBOMs are important because organizations increasingly rely on open source and third-party software components to build and maintain their applications. These components can introduce security vulnerabilities and must be adequately managed and updated. SBOMs help you understand what open source and third-party components are used in your applications, and identify and address any security vulnerabilities.
Under specific scenarios, generating and publishing SBOMs is mandatory for compliance with regulations and industry standards that require organizations to disclose the use of open source and third-party software in their products.
SBOM standards
There are several related standards, for example, CycloneDX, SPDX, SWID.
SPDX (Software Package Data Exchange) is a standard format for communicating a software package’s components, licenses, and copyrights. It is commonly used to document the open source components included in a proprietary software product. SPDX files can be easily read and understood by humans and machines, making it easy to track and manage open source components in a software project. SPDX format is supported by Linux Foundation.
CycloneDX is an open source standard for creating software bill of materials files. It is like SPDX in that it documents the components and licenses associated with a software package, but it is specifically designed for use in software supply chain security. CycloneDX is a more lightweight format compared to SPDX, which is intended to be more detailed. CycloneDX format is supported by OWASP.
SBOM architecture
A typical SBOM architecture can be laid out as a tree-like dependency graph with the following key elements:
- Component inventory: Information about the components, libraries, and other assets used in the software, including version numbers, licenses, and vulnerabilities.
- Dependency mapping: A map of relationships between different components and libraries, showing how they depend on each other and how changes to one may impact the other.
- License management: It should also include information about the licenses of the components and libraries used to ensure that the software complies with legal and ethical obligations.
SBOM generators
There are two typical ways to generate SBOM: during the build process, or after the build and deployment using a Software Composition Analysis tool. Trivy and Syft are two noteworthy open source generators among many other generators, including open source and commercial. Both use CycloneDX format. It is also important to note that not all SBOMs can be generated equally. Each generator may pick up a few language libraries better than the others based on its implementation. It might take multiple runs through a few different types of generators to draw comprehensive insights.
KubeClarity content analyzer integrates with the following SBOM generators:
Multiple SBOMs for accuracy
KubeClarity can run multiple SBOM generators in parallel, and unify their results to generate a more accurate document.
In such cases, KubeClarity compiles a merged SBOM from multiple open source analyzers, and delivers a comprehensive SBOM document report. Although KubeClarity does not generate SBOMs, it integrates with popular generators so that a combined document can provide amplified inputs that can be further analyzed using vulnerability scanners. Leveraging multiple SBOM documents can improve visibility into software dependency posture.
KubeClarity formats the merged SBOM to comply with the input requirements of vulnerability scanners before starting vulnerability scans.
Note: KubeClarity can merge vulnerability scans from various sources like Grype and Trivy to generate a robust vulnerability scan report.
Scan SBOM documents for vulnerabilities
You can feed the generated SBOM documents to vulnerability scanners, which analyze the SBOMs and generate a vulnerability report detailing all known and fixed CVEs of the software components listed by SBOM.
Generate SBOM
For details on generating SBOMs with KubeClarity, see the Getting started and Generate SBOM.
2.2 - Kubernetes cluster runtime scan
Scanning your runtime Kubernetes clusters is essential to proactively detect and address vulnerabilities in real-time, ensuring the security and integrity of your applications and infrastructure. By continuously monitoring and scanning your clusters, you can mitigate risks, prevent potential attacks, and maintain a strong security posture in the dynamic Kubernetes environment.
Runtime scan features
KubeClarity enhance the runtime scanning experience:
Faster runtime scan
KubeClarity optimizes the scanning process, reducing the time required to detect vulnerabilities. This allows for quicker identification and remediation of potential security risks.
Reduce image TAR pulling
KubeClarity uses an efficient approach that avoids the unnecessary overhead of fetching the complete image tar.
Cache SBOMs
If an image has already been scanned, KubeClarity uses the cached SBOM data, avoiding time-consuming image retrieval and recomputing, improving overall efficiency.
Runtime scan architecture
The following figure illustrates the structure of a runtime scanning architecture. This layout visually represents the components and their interconnections within the runtime scanning system.

For details on performing runtime scans with KubeClarity, see the Getting started and Runtime scan.
2.3 - Vulnerability scanning
Vulnerability scanning identifies weak spots in software code and dependencies. Vulnerability scanners can identify infrastructure, networks, applications, or website vulnerabilities. These tools scan various target systems for security flaws that attackers could exploit.
The scanners use the information contained in the SBOM to identify vulnerabilities and potential security risks within software applications. Vulnerability scanners use SBOM information to:
- Identify vulnerable components: Scanners use the SBOM to identify a software application’s components, then cross-reference this information with known vulnerabilities and security issues to identify vulnerable components within the software.
- Prioritize vulnerabilities: After the vulnerability scanner has identified all vulnerable components within the software application, it uses the SBOM to prioritize the vulnerabilities so you can focus on the most critical vulnerabilities.
- Identify supply chain risks: SBOMs provide visibility into the software supply chain, enabling vulnerability scanners to identify third-party or security risks. As a result, organizations can mitigate supply chain risks and reduce their overall security exposure.
- Track changes and updates: Software vulnerability scanners use SBOM information to determine whether software changes have introduced new vulnerabilities or security risks.
The SBOM is a critical tool for vulnerability scanners, providing the information needed to identify, prioritize, and mitigate security risks within software applications. In addition, scanners also rely on other types of inputs, as listed below.
KubeClarity and vulnerability scanning
KubeClarity isn’t a vulnerability scanner but integrates with top opensource vulnerability scanners. It also helps with prioritization and risk management by visualization and filtering. It is often necessary to prioritize CVEs because of the sheer volume of identified CVEs. With KubeClarity’s vulnerability trending dashboard and APIs, you can locate and double-click into a specific CVE in your application or infrastructure.
KubeClarity features a range of flexible and dynamic filters that help map CVEs down to an application->package->Image level. Additionally, it normalizes reports from multiple scanners and calculates missing CVSS (Common Vulnerability Scoring System) scores.
KubeClarity vulnerability scanner integrates with the following scanners:
KubeClarity supports both automatic scans to find common vulnerabilities quickly and efficiently, and manual scans to help verify automated scans, and also to help identify more complex and less common vulnerabilities. In addition to conventional scans, KubeClarity also provides multi-scanner integration.
Multi-scanner architecture
KubeClarity infrastructure enables multiple scanners’ configuration and simultaneous operation. Scanners in KubeClarity are designed to work in parallel.
The following figure shows the multi-scanner architecture for vulnerability scanning: KubeClarity preprocesses the SBOMs so they conform to the specific formatting requirements of the specific scanner. Each scanner may have different types and unique formatting expectations. The scanners analyze the incoming data and generate vulnerability outputs in their native formats.

KubeClarity can merge the vulnerability reports of different scanners, to include severity levels, sources, and available fixes. These reports serve as valuable outputs, allowing you to filter and focus on specific areas of vulnerabilities for further investigation and resolution.
Run vulnerability scans
For details on running vulnerability scans with KubeClarity, see the Getting started and Vulnerability scan.
3 - Getting started
This chapter guides you through the installation of the KubeClarity backend and the CLI, and shows you the most common tasks that you can perform with KubeClarity.
3.1 - Install the KubeClarity backend
You can install the KubeClarity backend using Helm, or you can build and run it locally.
Prerequisites
KubeClarity requires these Kubernetes permissions:
| Permission | Reason |
| Read secrets in CREDS_SECRET_NAMESPACE (default: kubeclarity) | This allows you to configure image pull secrets for scanning private image repositories. |
| Read config maps in the KubeClarity deployment namespace. | This is required for getting the configured template of the scanner job. |
| List pods in cluster scope. | This is required for calculating the target pods that need to be scanned. |
| List namespaces. | This is required for fetching the target namespaces to scan in K8s runtime scan UI. |
| Create and delete jobs in cluster scope. | This is required for managing the jobs that scan the target pods in their namespaces. |
Prerequisites for AWS
If you are installing KubeClarity on AWS, complete the following steps. These are needed because KubeClarity uses a persistent PostgreSQL database, and that requires a volume.
- Make sure that your EKS cluster is 1.23 or higher.
- Install the EBS CSI Driver EKS add-on. For details, see Amazon EKS add-ons.
- Configure the EBS CSI Driver with IAMServiceRole and policies. For details, see Creating the Amazon EBS CSI driver IAM role.
Install using Helm
-
Add the Helm repository.
helm repo add kubeclarity https://openclarity.github.io/kubeclarity
-
Save the default KubeClarity chart values.
helm show values kubeclarity/kubeclarity > values.yaml
-
(Optional) Check the configuration in the values.yaml file and update the required values if needed. You can skip this step to use the default configuration.
- To enable and configure the supported SBOM generators and vulnerability scanners, check the
analyzer and scanner configurations under the vulnerability-scanner section. You can skip this step to use the default configuration settings.
-
Deploy KubeClarity with Helm.
-
If you have customized the values.yaml file, run:
helm install --values values.yaml --create-namespace kubeclarity kubeclarity/kubeclarity --namespace kubeclarity
-
To use the default configuration, run:
helm install --create-namespace kubeclarity kubeclarity/kubeclarity --namespace kubeclarity
-
For an OpenShift Restricted SCC compatible installation, run:
helm install --values values.yaml --create-namespace kubeclarity kubeclarity/kubeclarity --namespace kubeclarity --set global.openShiftRestricted=true \
--set kubeclarity-postgresql.securityContext.enabled=false --set kubeclarity-postgresql.containerSecurityContext.enabled=false \
--set kubeclarity-postgresql.volumePermissions.enabled=true --set kubeclarity-postgresql.volumePermissions.securityContext.runAsUser="auto" \
--set kubeclarity-postgresql.shmVolume.chmod.enabled=false
-
Wait until all the pods are in ‘Running’ state. Check the output of the following command:
kubectl get pods --namespace kubeclarity
The output should be similar to:
NAME                                                    READY   STATUS    RESTARTS   AGE
kubeclarity-kubeclarity-7689c7fbb7-nlhh5                1/1     Running   0          82s
kubeclarity-kubeclarity-grype-server-79b6fb4b88-5xtbh   1/1     Running   0          82s
kubeclarity-kubeclarity-postgresql-0                    1/1     Running   0          82s
kubeclarity-kubeclarity-sbom-db-6895d97d5d-55jnj        1/1     Running   0          82s
-
Port-forward to the KubeClarity UI.
kubectl port-forward --namespace kubeclarity svc/kubeclarity-kubeclarity 9999:8080
-
(Optional) Install a sample application (sock shop) to run your scans on.
-
Create a namespace for the application.
kubectl create namespace sock-shop
-
Install the application.
kubectl apply -f https://raw.githubusercontent.com/microservices-demo/microservices-demo/master/deploy/kubernetes/complete-demo.yaml
-
Check that the installation was successful.
kubectl get pods --namespace sock-shop
Expected output:
NAME                            READY   STATUS    RESTARTS   AGE
carts-5dc994cf5b-4rhfj          2/2     Running   0          44h
carts-db-556cbbd5fb-64qls       2/2     Running   0          44h
catalogue-b7b968c97-b9k8p       2/2     Running   0          44h
catalogue-db-f7547dd6-smzk2     2/2     Running   0          44h
front-end-848c97475d-b7sl8      2/2     Running   0          44h
orders-7d47794476-9fjsx         2/2     Running   0          44h
orders-db-bbfb8f8-7ndr6         2/2     Running   0          44h
payment-77bd4bbdf6-hkzh7        2/2     Running   0          44h
queue-master-6d4cf8c4ff-pzk68   2/2     Running   0          44h
rabbitmq-9dd69888f-6lzfh        3/3     Running   0          44h
session-db-7d9d77c495-zngsn     2/2     Running   0          44h
shipping-67fff9d476-t87jw       2/2     Running   0          44h
user-7b667cd8d-q8bg8            2/2     Running   0          44h
user-db-5599d45948-vxpq6        2/2     Running   0          44h
-
Open the KubeClarity UI in your browser at http://localhost:9999/. The KubeClarity dashboard should appear. KubeClarity UI has no data to report vulnerabilities after a fresh install, so there is no data on the dashboard.

-
If you also want to try KubeClarity using its command-line tool, Install the CLI. Otherwise, you can run runtime scans using the dashboard.
Uninstall using Helm
Later if you have finished experimenting with KubeClarity, you can delete the backend by completing the following steps.
-
Helm uninstall
helm uninstall kubeclarity --namespace kubeclarity
-
Clean the resources. By default, Helm doesn’t remove the PVCs and PVs for the StatefulSets. Run the following command to delete them all:
kubectl delete pvc -l app.kubernetes.io/instance=kubeclarity --namespace kubeclarity
Build and run locally with demo data
-
Build the UI and the backend and start the backend locally, either using Docker, or without it:
-
Using docker:
-
Build UI and backend (the image tag is set using VERSION):
VERSION=test make docker-backend
-
Run the backend using demo data:
docker run -p 9999:8080 -e FAKE_RUNTIME_SCANNER=true -e FAKE_DATA=true -e ENABLE_DB_INFO_LOGS=true -e DATABASE_DRIVER=LOCAL ghcr.io/openclarity/kubeclarity:test run
-
Local build:
-
Build UI and backend
-
Copy the built site:
-
Run the backend locally using demo data:
FAKE_RUNTIME_SCANNER=true DATABASE_DRIVER=LOCAL FAKE_DATA=true ENABLE_DB_INFO_LOGS=true ./backend/bin/backend run
-
Open the KubeClarity UI in your browser: http://localhost:9999/
-
Install the CLI.
3.2 - Install the CLI
KubeClarity includes a CLI that can be run locally and is especially useful for CI/CD pipelines. It allows you to analyze images and directories to generate SBOM, and scan it for vulnerabilities. The results can be exported to the KubeClarity backend.
You can install the KubeClarity CLI using the following methods:
Binary Distribution
- Download the release distribution for your OS from the releases page.
- Unpack the
kubeclarity-cli binary, then add it to your PATH.
Docker Image
A Docker image is available at ghcr.io/openclarity/kubeclarity-cli with list of
available tags here.
Local Compilation
-
Clone the project repo.
-
Run:
-
Copy ./cli/bin/cli to your PATH under kubeclarity-cli.
Next step
Check the common tasks you can do using the web UI.
3.3 - First tasks - UI
After you have installed the KubeClarity backend and the KubeClarity CLI, complete the following tasks to see the basic functionality of KubeClarity web UI.
Runtime scan
To start a runtime scan, complete the following steps.
-
Open the UI in your browser at http://localhost:9999/.
-
From the navigation bar on the left, select Runtime Scan.
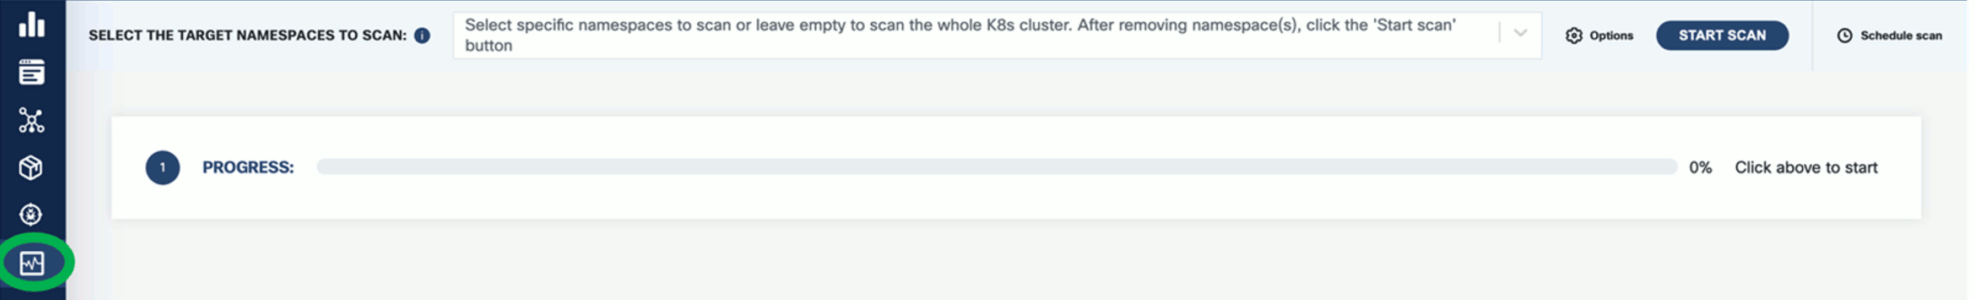
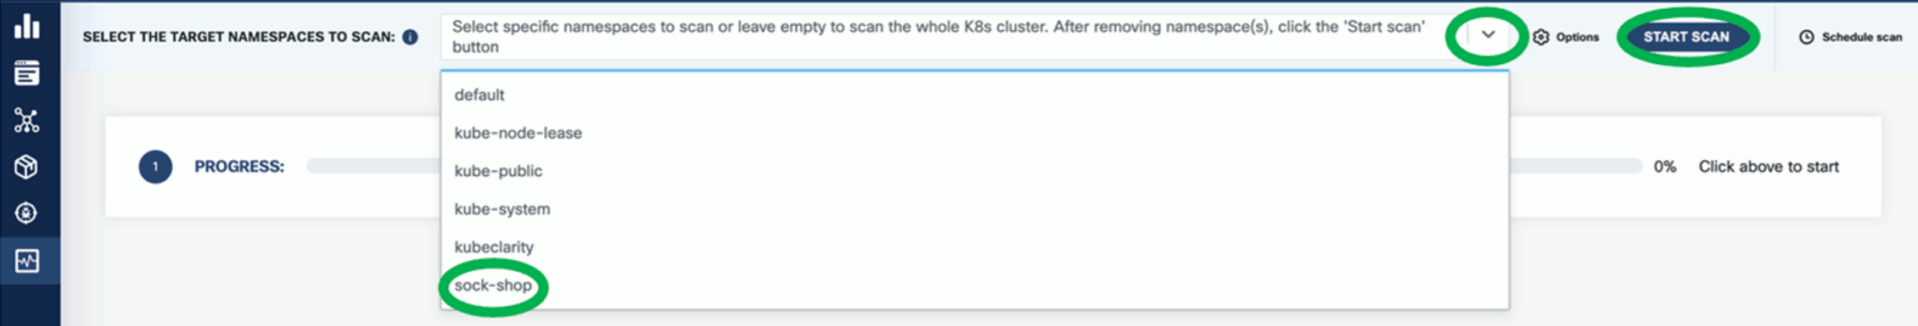
-
Select the namespace you want to scan, for example, the sock-shop namespace if you have installed the demo application, then click START SCAN. You can select multiple namespaces.
-
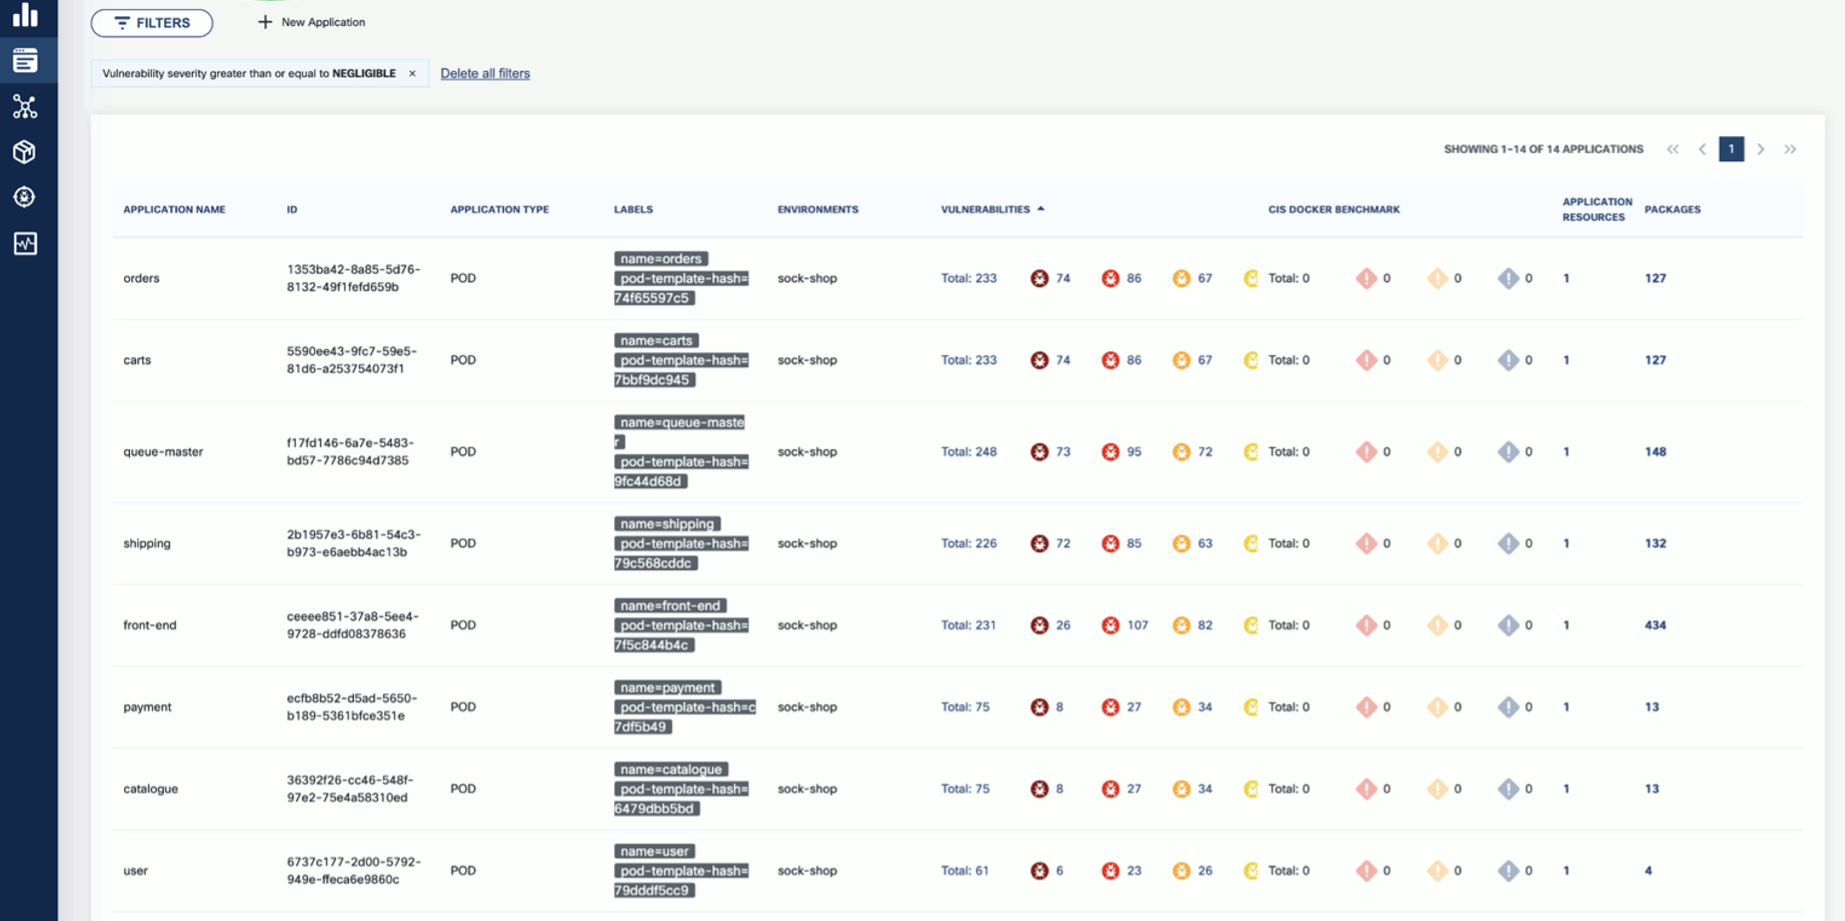
Wait until the scan is completed, then check the results. The scan results report the affected components such as Applications, Application Resources, Packages, and Vulnerabilities.

-
Click on these elements for details. For example, Applications shows the applications in the namespace that have vulnerabilities detected.
-
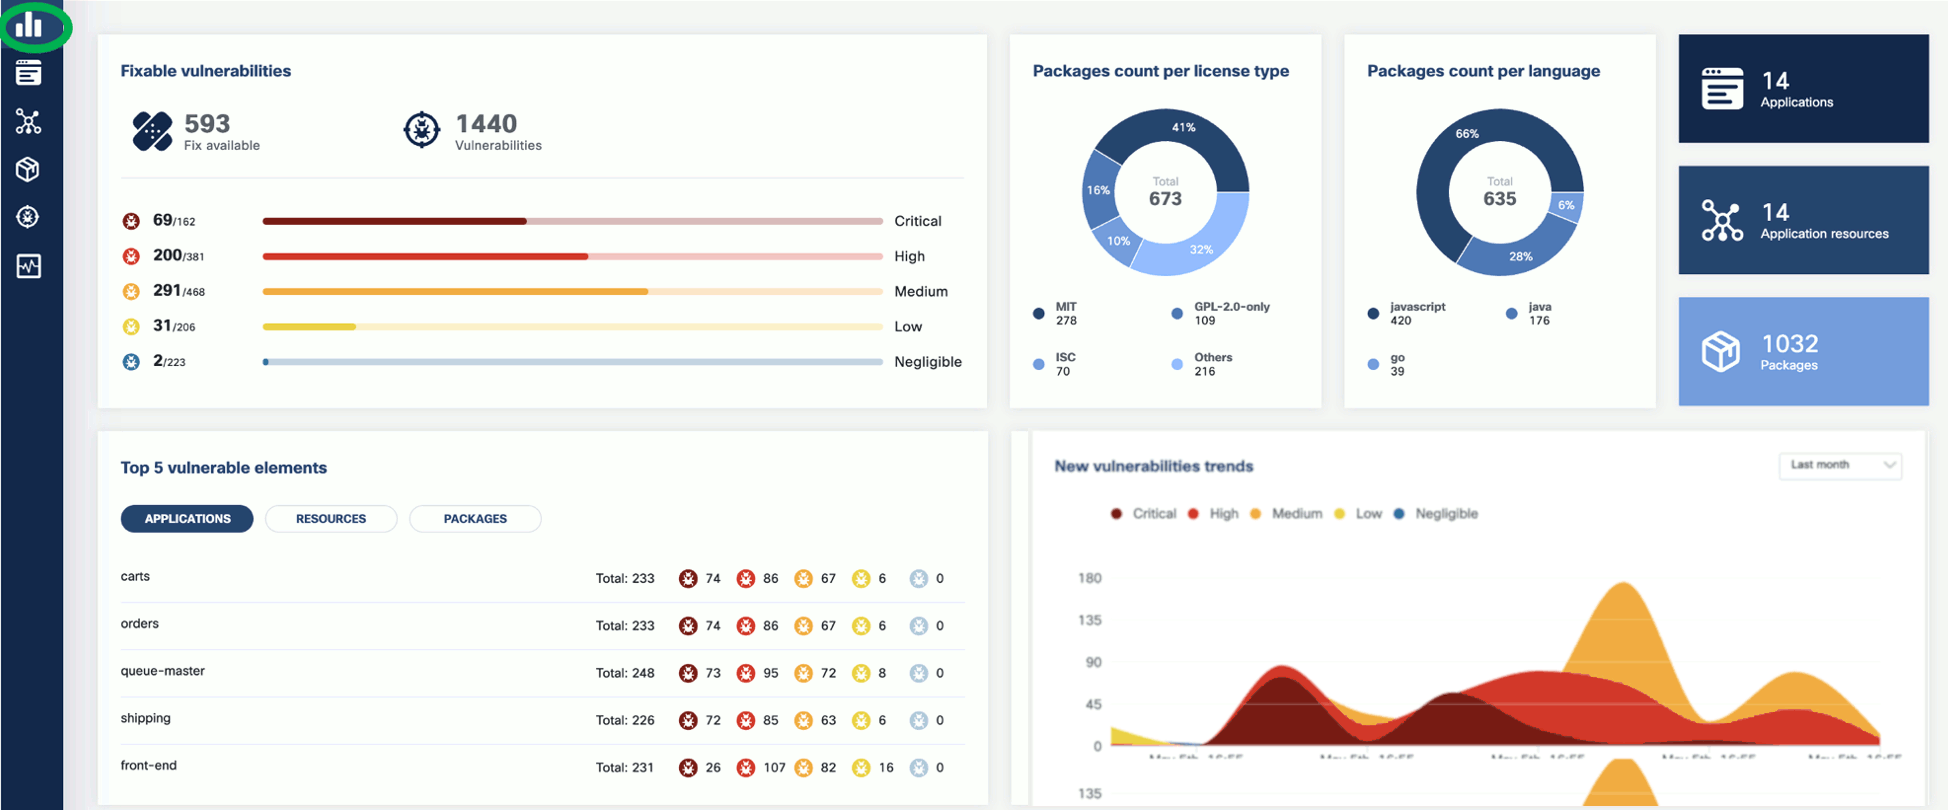
Now that you have run a scan, a summary of the results also appears on the dashboard page of the UI.
Vulnerability scan
-
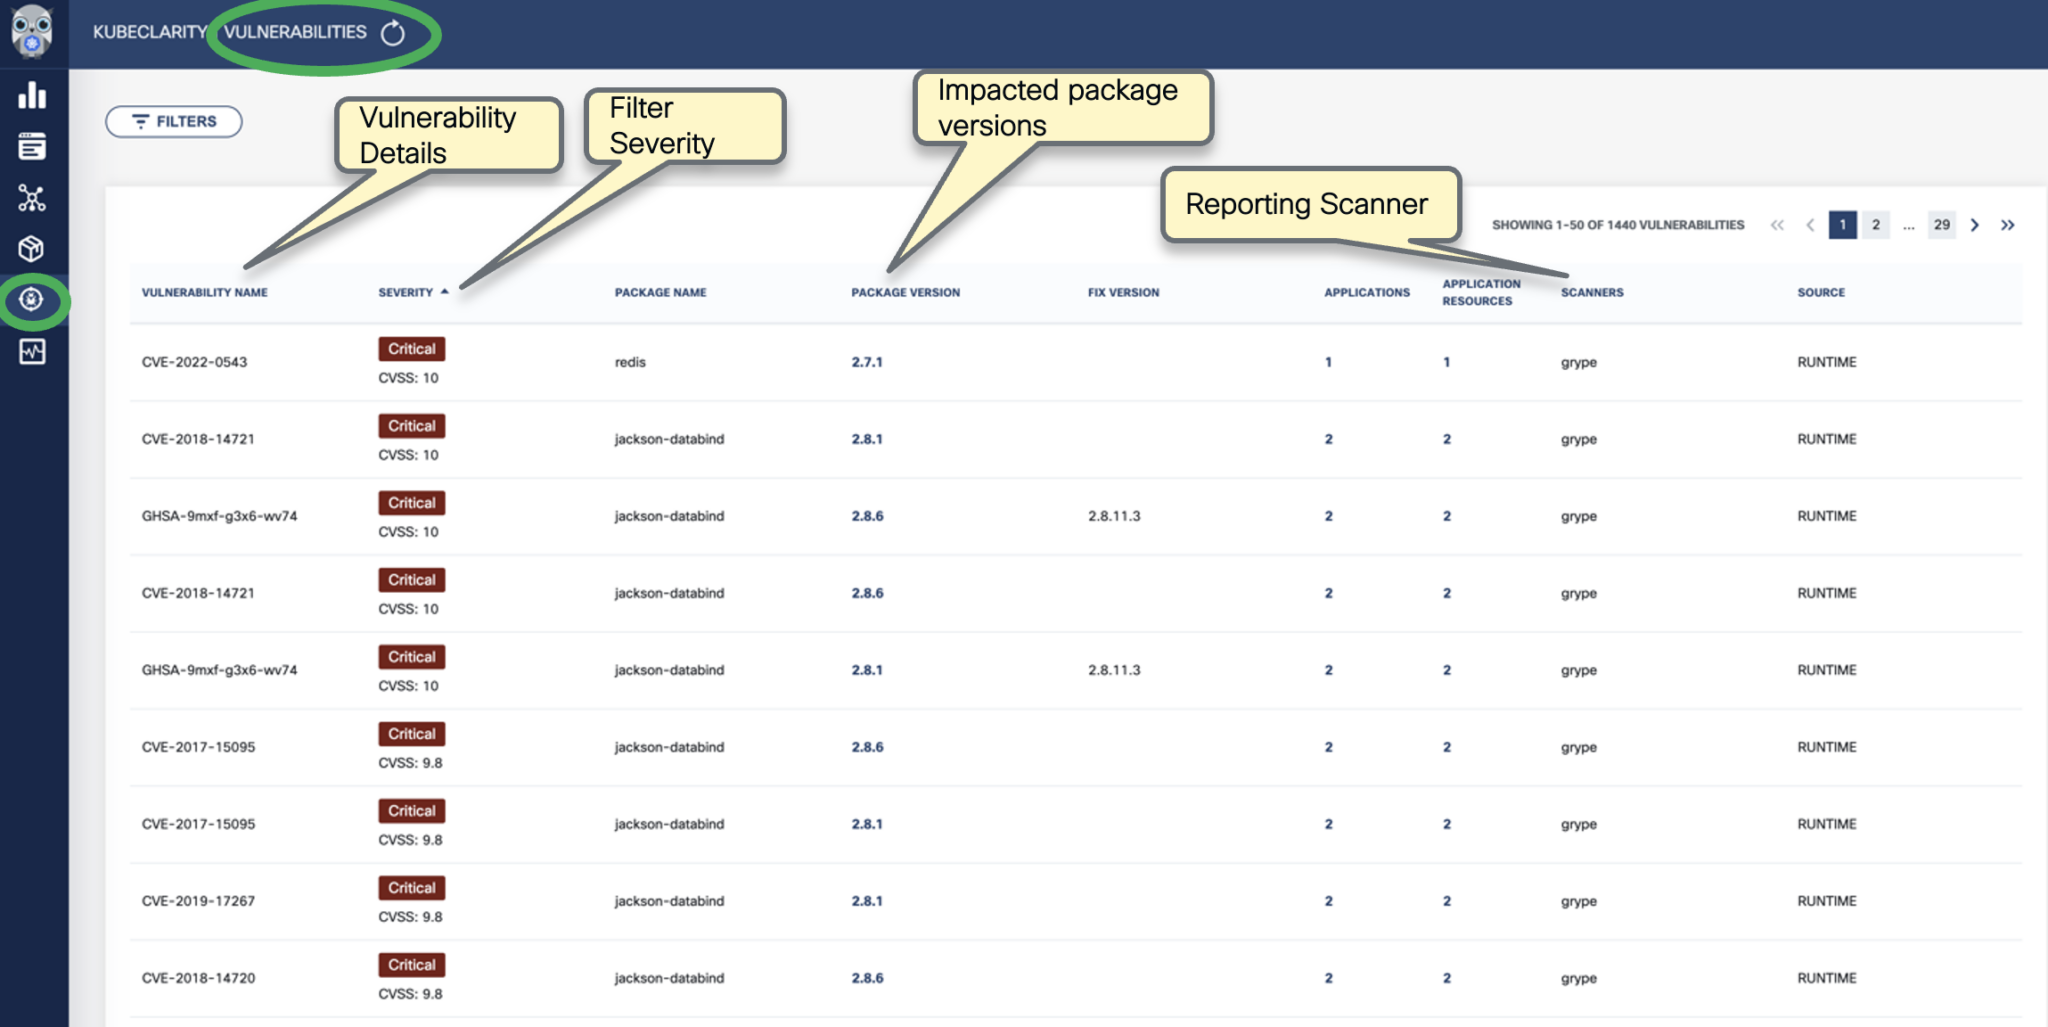
To see the results of a vulnerability scan, select the Vulnerabilities page in KubeClarity UI. It shows a report including the vulnerability names, severity, the package of origin, available fixes, and attribution to the scanner that reported the vulnerability.
-
You can click on any of these fields to access more in-depth information. For example, click on the name of a vulnerability in the VULNERABILITY NAME column.

-
Select CVSS to show the CVSS scores and other details reported from the scanning process.

-
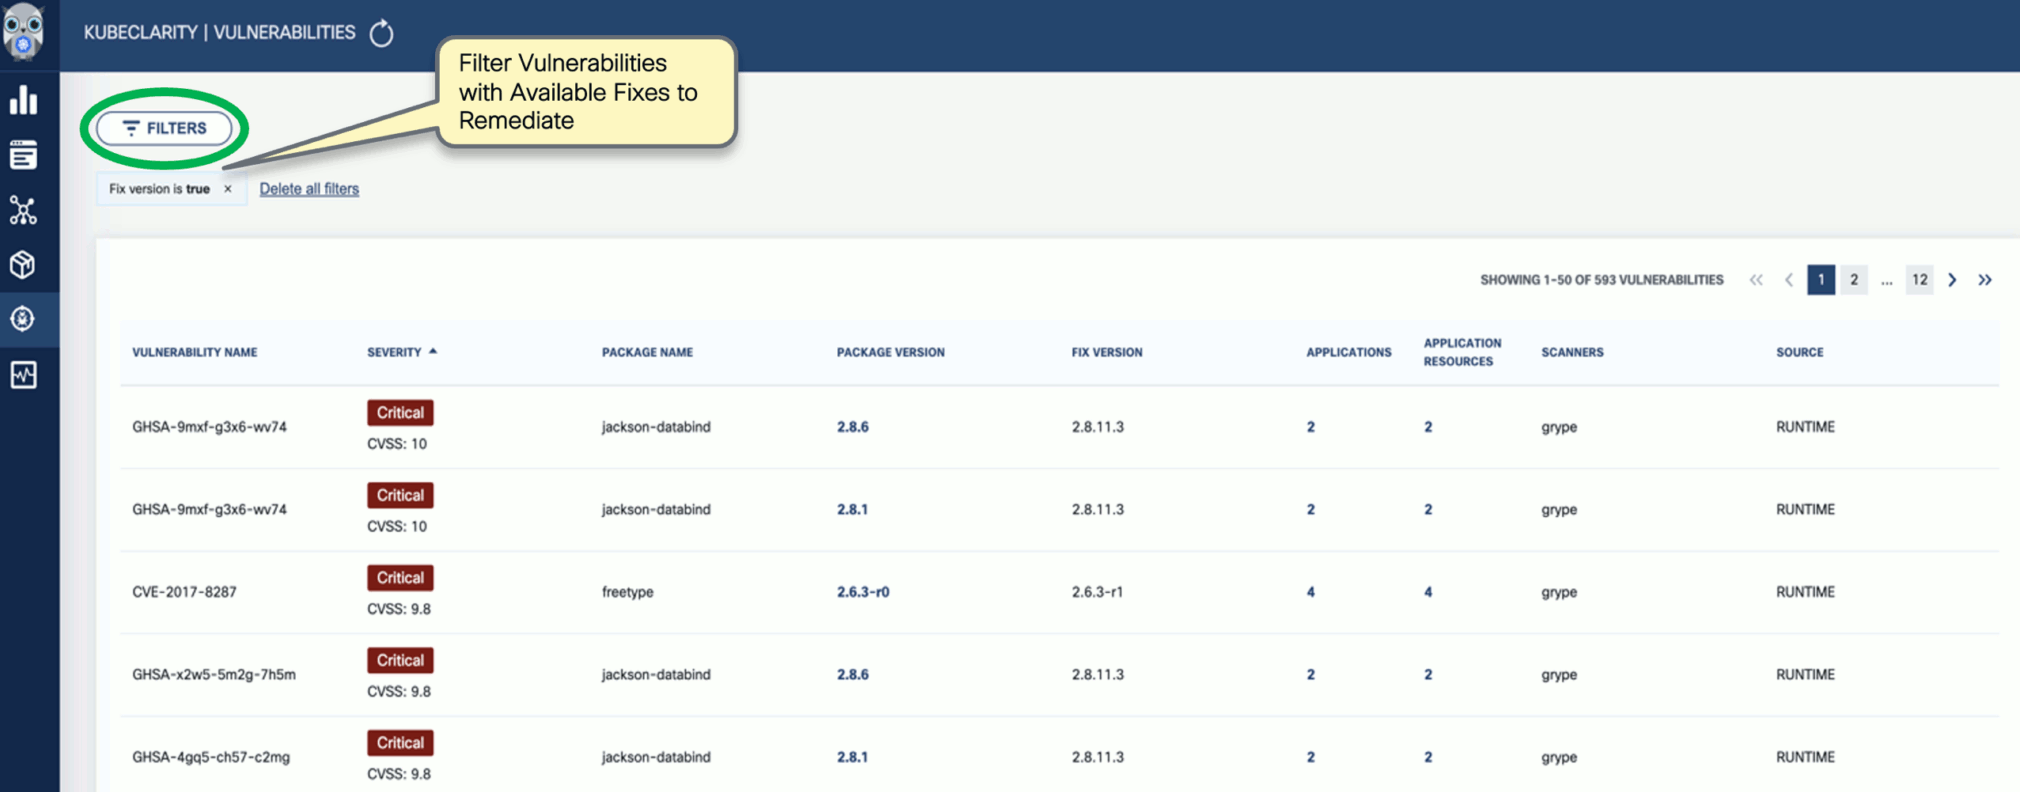
Navigate back to the Vulnerabilities view to explore the filtering options. Filtering helps you reduce noise and improve efficiency in identifying and potentially fixing crucial vulnerabilities.
-
The KubeClarity Dashboard gives you insights into vulnerability trends and fixable vulnerabilities.
Next step
Check the common tasks you can do using the CLI tool.
3.4 - First tasks - CLI
After you have installed the KubeClarity backend and the KubeClarity CLI, and completed the first tasks on the UI, complete the following tasks to see the basic functionality of the KubeClarity CLI.
Generate SBOM
To generate the Software Bill of Materials (SBOM), complete the following steps.
-
Run the following command.
kubeclarity-cli analyze <image/directory name> --input-type <dir|file|image(default)> -o <output file or stdout>
For example:
kubeclarity-cli analyze --input-type image nginx:latest -o nginx.sbom
Example output:
INFO[0000] Called syft analyzer on source registry:nginx:latest  analyzer=syft app=kubeclarity
INFO[0004] Skipping analyze unsupported source type: image  analyzer=gomod app=kubeclarity
INFO[0004] Sending successful results                    analyzer=syft app=kubeclarity
INFO[0004] Got result for job "syft"                     app=kubeclarity
INFO[0004] Got result for job "gomod"                    app=kubeclarity
INFO[0004] Skip generating hash in the case of image
-
Verify that the ngnix.sbom file is generated and explore its contents as in below:
Example output:
{
  "bomFormat": "CycloneDX",
  "specVersion": "1.4",
  "serialNumber": "urn:uuid:8cca2aa3-1aaa-4e8c-9d44-08e88b1df50d",
  "version": 1,
  "metadata": {
    "timestamp": "2023-05-19T16:27:27-07:00",
    "tools": [
      {
        "vendor": "kubeclarity",
-
To run also the trivy scanner and merge the output into a single SBOM, run:
ANALYZER_LIST="syft gomod trivy" kubeclarity-cli analyze --input-type image nginx:latest -o nginx.sbom
Example output:
INFO[0000] Called syft analyzer on source registry:nginx:latest  analyzer=syft app=kubeclarity
INFO[0004] Called trivy analyzer on source image nginx:latest  analyzer=trivy app=kubeclarity
INFO[0004] Skipping analyze unsupported source type: image  analyzer=gomod app=kubeclarity
INFO[0005] Sending successful results                    analyzer=syft app=kubeclarity
INFO[0005] Sending successful results                    analyzer=trivy app=kubeclarity
INFO[0005] Got result for job "trivy"                    app=kubeclarity
INFO[0005] Got result for job "syft"                     app=kubeclarity
INFO[0005] Got result for job "gomod"                    app=kubeclarity
INFO[0005] Skip generating hash in the case of image
Vulnerability scan
You can scan vulnerabilities by running the appropriate commands. The CLI provides flexibility and automation capabilities for integrating vulnerability scanning into your existing workflows or CI/CD pipelines. The tool allows scanning an image, directory, file, or a previously generated SBOM.
Usage:
kubeclarity-cli scan <image/sbom/directory/file name> --input-type <sbom|dir|file|image(default)> -f <output file>
Example:
kubeclarity-cli scan nginx.sbom --input-type sbom
You can list the vulnerability scanners to use using the SCANNERS_LIST environment variable separated by a space (SCANNERS_LIST="<Scanner1 name> <Scanner2 name>"). For example:
SCANNERS_LIST="grype trivy" kubeclarity-cli scan nginx.sbom --input-type sbom
Example output:
INFO[0000] Called trivy scanner on source sbom nginx.sbom  app=kubeclarity scanner=trivy
INFO[0000] Loading DB. update=true                       app=kubeclarity mode=local scanner=grype
INFO[0000] Need to update DB                             app=kubeclarity scanner=trivy
INFO[0000] DB Repository: ghcr.io/aquasecurity/trivy-db  app=kubeclarity scanner=trivy
INFO[0000] Downloading DB...                             app=kubeclarity scanner=trivy
INFO[0010] Gathering packages for source sbom:nginx.sbom  app=kubeclarity mode=local scanner=grype
INFO[0010] Found 136 vulnerabilities                     app=kubeclarity mode=local scanner=grype
INFO[0011] Sending successful results                    app=kubeclarity mode=local scanner=grype
INFO[0011] Got result for job "grype"                    app=kubeclarity
INFO[0012] Vulnerability scanning is enabled             app=kubeclarity scanner=trivy
INFO[0012] Detected SBOM format: cyclonedx-json          app=kubeclarity scanner=trivy
INFO[0012] Detected OS: debian                           app=kubeclarity scanner=trivy
INFO[0012] Detecting Debian vulnerabilities...           app=kubeclarity scanner=trivy
INFO[0012] Number of language-specific files: 1          app=kubeclarity scanner=trivy
INFO[0012] Detecting jar vulnerabilities...              app=kubeclarity scanner=trivy
INFO[0012] Sending successful results                    app=kubeclarity scanner=trivy
INFO[0012] Found 136 vulnerabilities                     app=kubeclarity scanner=trivy
INFO[0012] Got result for job "trivy"                    app=kubeclarity
INFO[0012] Merging result from "grype"                   app=kubeclarity
INFO[0012] Merging result from "trivy"                   app=kubeclarity
NAME              INSTALLED                FIXED-IN  VULNERABILITY     SEVERITY    SCANNERS
curl              7.74.0-1.3+deb11u7                 CVE-2023-23914    CRITICAL    grype(*), trivy(*)
curl              7.74.0-1.3+deb11u7                 CVE-2023-27536    CRITICAL    grype(*), trivy(*)
libcurl4          7.74.0-1.3+deb11u7                 CVE-2023-27536    CRITICAL    grype(*), trivy(*)
libdb5.3          5.3.28+dfsg1-0.8                   CVE-2019-8457     CRITICAL    grype(*), trivy(*)
libcurl4          7.74.0-1.3+deb11u7                 CVE-2023-23914    CRITICAL    grype(*), trivy(*)
perl-base         5.32.1-4+deb11u2                   CVE-2023-31484    HIGH        grype(*), trivy(*)
libss2            1.46.2-2                           CVE-2022-1304     HIGH        grype(*), trivy(*)
bash              5.1-2+deb11u1                      CVE-2022-3715     HIGH        grype(*), trivy(*)
Export results to KubeClarity backend
To export the CLI results to the KubeClarity backend, complete the following steps.
-
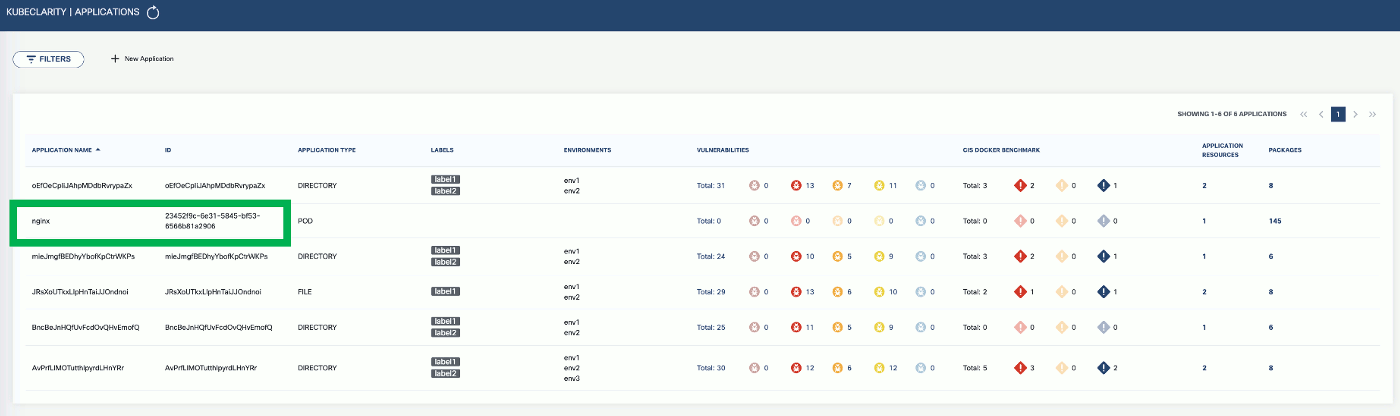
To export CLI-generated results to the backend, from the left menu bar select Applications, then copy the ID from the KubeClarity UI. If your application is not listed yet, select + New Application, and create a new pod.
-
To export the generated SBOMs to a running KubeClarity backend pod, use the -e flag and the ID as the <application ID> value in the following command.
BACKEND_HOST=<KubeClarity backend address> BACKEND_DISABLE_TLS=true kubeclarity-cli analyze <image> --application-id <application ID> -e -o <SBOM output file>
For example:
BACKEND_HOST=localhost:9999 BACKEND_DISABLE_TLS=true kubeclarity-cli analyze nginx:latest --application-id 23452f9c-6e31-5845-bf53-6566b81a2906 -e -o nginx.sbom
Example output:
INFO[0000] Called syft analyzer on source registry:nginx:latest  analyzer=syft app=kubeclarity
INFO[0004] Called trivy analyzer on source image nginx:latest  analyzer=trivy app=kubeclarity
INFO[0004] Skipping analyze unsupported source type: image  analyzer=gomod app=kubeclarity
INFO[0004] Sending successful results                    analyzer=syft app=kubeclarity
INFO[0004] Got result for job "syft"                     app=kubeclarity
INFO[0004] Got result for job "gomod"                    app=kubeclarity
INFO[0004] Sending successful results                    analyzer=trivy app=kubeclarity
INFO[0004] Got result for job "trivy"                    app=kubeclarity
INFO[0004] Skip generating hash in the case of image
INFO[0004] Exporting analysis results to the backend: localhost:8080  app=kubeclarity
-
To export the vulnerability scan results to the KubeClarity backend, set the BACKEND_HOST environment variable and the -e flag.
Note: Until TLS is supported, set BACKEND_DISABLE_TLS=true.
BACKEND_HOST=<KubeClarity backend address> BACKEND_DISABLE_TLS=true kubeclarity-cli scan <image> --application-id <application ID> -e
For example:
SCANNERS_LIST="grype" BACKEND_HOST=localhost:9999 BACKEND_DISABLE_TLS=true kubeclarity-cli scan nginx.sbom --input-type sbom --application-id 23452f9c-6e31-5845-bf53-6566b81a2906 -e
- Now you can see the exported results on the UI, for example, on the Dashboard page.
Next step
Now that you have finished the getting started guide, explore the UI, or check the documentation for other use cases.
4 - Generate SBOM
A software bill of materials (SBOM) is a list of all the components, libraries, and other dependencies that make up a software application, along with information about the versions, licenses, and vulnerabilities associated with each component. They are formal, structured documents detailing the components of a software product and its supply chain relationships.
KubeClarity exposes SBOM generator integration settings via the values.yaml file.
KubeClarity content analyzer integrates with the following SBOM generators:
Trivy has an extensive vulnerability database, which includes CVEs from various sources such as NVD, Red Hat, and Debian. It can detect vulnerabilities in multiple programming languages, including Java, Python, and Ruby.
Syft’s vulnerability database is smaller and primarily focuses on detecting vulnerabilities in Python libraries.
KubeClarity, by default, enables Syft and CycloneDX gomod analyzers. To enable the Trivy scanner, edit the values. yaml file like this:
    analyzer:
      ## Space separated list of analyzers. (syft gomod)
      analyzerList: "syft gomod trivy"
      analyzerScope: "squashed"

      trivy:
        ## Enable trivy scanner, if true make sure to add it to list above
        enabled: true
        timeout: "300"
SBOM database
KubeClarity automatically deploys an SBOM database pod and caches the generated SBOMs in the SBOM DB. The database is a lightweight SQLite DB that avoids persistent volume storage overheads. It stores and retrieves SBOM documents in a string format and serves as a caching function for rendering SBOM data. The DB does not store or query JSON objects to parse or query the SBOMs. However, it supports a gzip compression and base64 encoded storage to reduce memory footprint.
Here is the corresponding configuration snippet from the values.yaml file:
## KubeClarity SBOM DB Values

kubeclarity-sbom-db:
  ## Docker Image values.
  docker:
    ## Use to overwrite the global docker params
    ##
    imageName: ""

  ## Logging level (debug, info, warning, error, fatal, panic).
  logLevel: warning

  servicePort: 8080

  resources:
    requests:
      memory: "20Mi"
      cpu: "10m"
    limits:
      memory: "100Mi"
      cpu: "100m"

## End of KubeClarity SBOM DB Values
4.1 - Generate SBOM
To generate the Software Bill of Materials (SBOM), complete the following steps.
-
Run the following command.
kubeclarity-cli analyze <image/directory name> --input-type <dir|file|image(default)> -o <output file or stdout>
For example:
kubeclarity-cli analyze --input-type image nginx:latest -o nginx.sbom
Example output:
INFO[0000] Called syft analyzer on source registry:nginx:latest  analyzer=syft app=kubeclarity
INFO[0004] Skipping analyze unsupported source type: image  analyzer=gomod app=kubeclarity
INFO[0004] Sending successful results                    analyzer=syft app=kubeclarity
INFO[0004] Got result for job "syft"                     app=kubeclarity
INFO[0004] Got result for job "gomod"                    app=kubeclarity
INFO[0004] Skip generating hash in the case of image
-
Verify that the ngnix.sbom file is generated and explore its contents as in below:
Example output:
{
  "bomFormat": "CycloneDX",
  "specVersion": "1.4",
  "serialNumber": "urn:uuid:8cca2aa3-1aaa-4e8c-9d44-08e88b1df50d",
  "version": 1,
  "metadata": {
    "timestamp": "2023-05-19T16:27:27-07:00",
    "tools": [
      {
        "vendor": "kubeclarity",
-
To run also the trivy scanner and merge the output into a single SBOM, run:
ANALYZER_LIST="syft gomod trivy" kubeclarity-cli analyze --input-type image nginx:latest -o nginx.sbom
Example output:
INFO[0000] Called syft analyzer on source registry:nginx:latest  analyzer=syft app=kubeclarity
INFO[0004] Called trivy analyzer on source image nginx:latest  analyzer=trivy app=kubeclarity
INFO[0004] Skipping analyze unsupported source type: image  analyzer=gomod app=kubeclarity
INFO[0005] Sending successful results                    analyzer=syft app=kubeclarity
INFO[0005] Sending successful results                    analyzer=trivy app=kubeclarity
INFO[0005] Got result for job "trivy"                    app=kubeclarity
INFO[0005] Got result for job "syft"                     app=kubeclarity
INFO[0005] Got result for job "gomod"                    app=kubeclarity
INFO[0005] Skip generating hash in the case of image
Export scan results to backend
-
To export CLI-generated results to the backend, from the left menu bar select Applications, then copy the ID from the KubeClarity UI. If your application is not listed yet, select + New Application, and create a new pod.
-
To export the generated SBOMs to a running KubeClarity backend pod, use the -e flag and the ID as the <application ID> value in the following command.
BACKEND_HOST=<KubeClarity backend address> BACKEND_DISABLE_TLS=true kubeclarity-cli analyze <image> --application-id <application ID> -e -o <SBOM output file>
For example:
BACKEND_HOST=localhost:9999 BACKEND_DISABLE_TLS=true kubeclarity-cli analyze nginx:latest --application-id 23452f9c-6e31-5845-bf53-6566b81a2906 -e -o nginx.sbom
Example output:
INFO[0000] Called syft analyzer on source registry:nginx:latest  analyzer=syft app=kubeclarity
INFO[0004] Called trivy analyzer on source image nginx:latest  analyzer=trivy app=kubeclarity
INFO[0004] Skipping analyze unsupported source type: image  analyzer=gomod app=kubeclarity
INFO[0004] Sending successful results                    analyzer=syft app=kubeclarity
INFO[0004] Got result for job "syft"                     app=kubeclarity
INFO[0004] Got result for job "gomod"                    app=kubeclarity
INFO[0004] Sending successful results                    analyzer=trivy app=kubeclarity
INFO[0004] Got result for job "trivy"                    app=kubeclarity
INFO[0004] Skip generating hash in the case of image
INFO[0004] Exporting analysis results to the backend: localhost:8080  app=kubeclarity
-
Now you can see the exported results on the UI, on the Dashboard and the Packages pages.

Run multiple generators
You can list the content analyzers to use using the ANALYZER_LIST environment variable separated by a space (ANALYZER_LIST="<analyzer 1 name> <analyzer 2 name>"). For example:
ANALYZER_LIST="syft gomod" kubeclarity-cli analyze --input-type image nginx:latest -o nginx.sbom
KubeClarity content analyzer integrates with the following SBOM generators:
4.2 - Merging SBOM results
Different SBOM generators support different outputs, and the different vulnerability analyzers support different input SBOM formats. KubeClarity merges the output of multiple SBOM scanners and converts them into the format required by vulnerability scanners.

When multiple analyzers identify the same resources, KubeClarity handles them as a union and labels both analyzers as the source. Instead of attempting to merge the raw data produced by each generator, KubeClarity adds additional metadata to the generated SBOMs while keeping the raw data untouched, as reported by the analyzers.
KubeClarity can also merge SBOMs from various stages of a CI/CD pipeline into a single SBOM by layering and merging, for example, application dependency SBOM analysis from application build time can be augmented with the image dependencies analysis during the image build phase. The merged SBOMs serve as inputs to vulnerability scanners after proper formatting.

4.3 - SBOM output format
The kubeclarity-cli analyze command can format the resulting SBOM into different formats to integrate with another system. The supported formats are:
| Format | Configuration Name |
| CycloneDX JSON (default) | cyclonedx-json |
| CycloneDX XML | cyclonedx-xml |
| SPDX JSON | spdx-json |
| SPDX Tag Value | spdx-tv |
| Syft JSON | syft-json |
CAUTION:
KubeClarity processes CycloneDX internally, the other formats are supported through a conversion. The conversion process can be lossy due to incompatibilities between formats, therefore in some cases not all fields/information are present in the resulting output.
To configure the kubeclarity-cli to use a format other than the default, the ANALYZER_OUTPUT_FORMAT environment variable can be used with the configuration name from above:
ANALYZER_OUTPUT_FORMAT="spdx-json" kubeclarity-cli analyze nginx:latest -o nginx.sbom
5 - Runtime scan
Scanning your runtime Kubernetes clusters is essential to proactively detect and address vulnerabilities in real-time, ensuring the security and integrity of your applications and infrastructure. By continuously monitoring and scanning your clusters, you can mitigate risks, prevent potential attacks, and maintain a strong security posture in the dynamic Kubernetes environment.
For details on the concepts of KubeClarity runtime scan, see Kubernetes cluster runtime scan.
5.1 - Run a runtime scan
To start a runtime scan, complete the following steps.
-
Open the UI in your browser at http://localhost:9999/.
-
From the navigation bar on the left, select Runtime Scan.
-
Select the namespace you want to scan, for example, the sock-shop namespace if you have installed the demo application, then click START SCAN. You can select multiple namespaces.
-
Wait until the scan is completed, then check the results. The scan results report the affected components such as Applications, Application Resources, Packages, and Vulnerabilities.
-
Click on these elements for details. For example, Applications shows the applications in the namespace that have vulnerabilities detected.
-
Now that you have run a scan, a summary of the results also appears on the dashboard page of the UI.
5.2 - Schedule runtime scan
To schedule a runtime scan that runs at a specific time, complete the following steps. You can also configure recurring scans to periodically scan your namespaces.
-
Open the UI in your browser at http://localhost:9999/.
-
From the navigation bar on the left, select Runtime Scan.
-
Click Schedule Scan.

-
Select the namespace or namespaces you want to scan.

-
(Optional) If you have already configured CIS benchmarks, you can select CIS Docker Benchmark to enable them for the scheduled scan.
-
Set the type of the scan.
- Later: Run the scan once at the specified time.
- Repetitive: A recurring scan that runs periodically.

-
Set the time of the scan, then click SAVE.
- For a one-time scan, set the date and time when it should run.
- For a repetitive scan, set its frequency.

5.3 - Configure CIS benchmarks
Developed by the Center for Internet Security (CIS), CIS benchmarks provide industry-recognized guidelines and recommendations for securing systems, networks, and software applications.
CIS Benchmarks are consensus-based guidelines that outline recommended security configurations and settings for various technology platforms, including operating systems, databases, web servers, and more. For more details, see CIS Docker Benchmark: Guidance for securing Docker containers and
CIS Kubernetes Benchmark: Guidance for securing Kubernetes clusters.
By following these steps and customizing the CIS benchmarks configuration in the values.yaml file, you can effectively run and assess your Kubernetes cluster’s adherence to the CIS benchmarks and evaluate fatal, info, and warning level findings. To configure KubeClarity for running CIS benchmarks, complete the following steps.
-
Clone or download the KubeClarity repository to your local machine, and open the values.yaml file in a text editor.
-
Locate the cis-docker-benchmark-scanner section.
-
Customize the configuration based on your specific requirements. You can enable or disable specific CIS benchmarks, set thresholds, and define compliance levels.
For example:
cis-docker-benchmark-scanner:
## Docker Image values.
docker:
  ## Use to overwrite the global docker params
  ##
  imageName: ""

## Scanner logging level (debug, info, warning, error, fatal, panic).
logLevel: warning

## Timeout for the cis docker benchmark scanner job.
timeout: "2m"

resources:
  requests:
    memory: "50Mi"
    cpu: "50m"
  limits:
    memory: "1000Mi"
    cpu: "1000m"
-
Save the changes to the configuration file.
-
Deploy the KubeClarity backend in your Kubernetes cluster using the modified values.yaml file.
-
Once KubeClarity is up and running, it automatically applies the configured CIS benchmarks and evaluates your Kubernetes cluster against them.
-
Monitor the KubeClarity dashboard, or check the generated reports to review your cluster’s compliance with the CIS benchmarks.
Enable CIS benchmarks
To enable the configured benchmark scans for on-demand runtime scans, complete the following steps.
-
Open the UI in your browser at http://localhost:9999/.
-
From the navigation bar on the left, select Runtime Scan, then Options.

-
Enable the CIS Docker Benchmark option, then click SAVE.

CIS benchmark results
-
If you run a scan with CIS benchmarks enabled, the scan results are shown in the scan report:

-
You can drill down further by applying filters. The filter allows you to narrow down the results and focus on the specific aspects you are interested in. Use the provided filters to navigate the CIS benchmark details and access the necessary information for your compliance analysis.

-
Click on a group in the AFFECTED ELEMENTS row to see the alerts and the details.
-
Click CIS Docker Benchmark to see a drill-down view of CIS Benchmarks and a detailed benchmark description. This deeper level of visibility enables you to investigate and address the alerts more effectively, ensuring the security and compliance of your Kubernetes environment.

6 - Vulnerability scan
Vulnerability scanning identifies weak spots in software code and dependencies. Vulnerability scanners can identify infrastructure, networks, applications, or website vulnerabilities. These tools scan various target systems for security flaws that attackers could exploit.
6.1 - Run a vulnerability scan
You can scan vulnerabilities by running the appropriate commands. The CLI provides flexibility and automation capabilities for integrating vulnerability scanning into your existing workflows or CI/CD pipelines. The tool allows scanning an image, directory, file, or a previously generated SBOM.
Usage:
kubeclarity-cli scan <image/sbom/directory/file name> --input-type <sbom|dir|file|image(default)> -f <output file>
Example:
kubeclarity-cli scan nginx.sbom --input-type sbom
You can list the vulnerability scanners to use using the SCANNERS_LIST environment variable separated by a space (SCANNERS_LIST="<Scanner1 name> <Scanner2 name>"). For example:
SCANNERS_LIST="grype trivy" kubeclarity-cli scan nginx.sbom --input-type sbom
Example output:
INFO[0000] Called trivy scanner on source sbom nginx.sbom  app=kubeclarity scanner=trivy
INFO[0000] Loading DB. update=true                       app=kubeclarity mode=local scanner=grype
INFO[0000] Need to update DB                             app=kubeclarity scanner=trivy
INFO[0000] DB Repository: ghcr.io/aquasecurity/trivy-db  app=kubeclarity scanner=trivy
INFO[0000] Downloading DB...                             app=kubeclarity scanner=trivy
INFO[0010] Gathering packages for source sbom:nginx.sbom  app=kubeclarity mode=local scanner=grype
INFO[0010] Found 136 vulnerabilities                     app=kubeclarity mode=local scanner=grype
INFO[0011] Sending successful results                    app=kubeclarity mode=local scanner=grype
INFO[0011] Got result for job "grype"                    app=kubeclarity
INFO[0012] Vulnerability scanning is enabled             app=kubeclarity scanner=trivy
INFO[0012] Detected SBOM format: cyclonedx-json          app=kubeclarity scanner=trivy
INFO[0012] Detected OS: debian                           app=kubeclarity scanner=trivy
INFO[0012] Detecting Debian vulnerabilities...           app=kubeclarity scanner=trivy
INFO[0012] Number of language-specific files: 1          app=kubeclarity scanner=trivy
INFO[0012] Detecting jar vulnerabilities...              app=kubeclarity scanner=trivy
INFO[0012] Sending successful results                    app=kubeclarity scanner=trivy
INFO[0012] Found 136 vulnerabilities                     app=kubeclarity scanner=trivy
INFO[0012] Got result for job "trivy"                    app=kubeclarity
INFO[0012] Merging result from "grype"                   app=kubeclarity
INFO[0012] Merging result from "trivy"                   app=kubeclarity
NAME              INSTALLED                FIXED-IN  VULNERABILITY     SEVERITY    SCANNERS
curl              7.74.0-1.3+deb11u7                 CVE-2023-23914    CRITICAL    grype(*), trivy(*)
curl              7.74.0-1.3+deb11u7                 CVE-2023-27536    CRITICAL    grype(*), trivy(*)
libcurl4          7.74.0-1.3+deb11u7                 CVE-2023-27536    CRITICAL    grype(*), trivy(*)
libdb5.3          5.3.28+dfsg1-0.8                   CVE-2019-8457     CRITICAL    grype(*), trivy(*)
libcurl4          7.74.0-1.3+deb11u7                 CVE-2023-23914    CRITICAL    grype(*), trivy(*)
perl-base         5.32.1-4+deb11u2                   CVE-2023-31484    HIGH        grype(*), trivy(*)
libss2            1.46.2-2                           CVE-2022-1304     HIGH        grype(*), trivy(*)
bash              5.1-2+deb11u1                      CVE-2022-3715     HIGH        grype(*), trivy(*)
Export results to KubeClarity backend
To export the CLI results to the KubeClarity backend, complete the following steps.
-
To export CLI-generated results to the backend, from the left menu bar select Applications, then copy the ID from the KubeClarity UI. If your application is not listed yet, select + New Application, and create a new pod.
-
To export the vulnerability scan results to the KubeClarity backend, set the BACKEND_HOST environment variable and the -e flag.
Note: Until TLS is supported, set BACKEND_DISABLE_TLS=true.
BACKEND_HOST=<KubeClarity backend address> BACKEND_DISABLE_TLS=true kubeclarity-cli scan <image> --application-id <application ID> -e
For example:
SCANNERS_LIST="grype" BACKEND_HOST=localhost:9999 BACKEND_DISABLE_TLS=true kubeclarity-cli scan nginx.sbom --input-type sbom --application-id 23452f9c-6e31-5845-bf53-6566b81a2906 -e
- Now you can see the exported results on the UI.
Check scan results on the UI
-
To see the results of a vulnerability scan, select the Vulnerabilities page in KubeClarity UI. It shows a report including the vulnerability names, severity, the package of origin, available fixes, and attribution to the scanner that reported the vulnerability.
-
You can click on any of these fields to access more in-depth information. For example, click on the name of a vulnerability in the VULNERABILITY NAME column.
-
Select CVSS to show the CVSS scores and other details reported from the scanning process.
-
Navigate back to the Vulnerabilities view to explore the filtering options. Filtering helps you reduce noise and improve efficiency in identifying and potentially fixing crucial vulnerabilities.
-
The KubeClarity Dashboard gives you insights into vulnerability trends and fixable vulnerabilities.
6.2 - Vulnerability scanning a local docker image
You can scan local docker images using the LOCAL_IMAGE_SCAN environment variable.
-
Generate the SBOM for your local docker image. For example:
LOCAL_IMAGE_SCAN=true kubeclarity-cli analyze nginx:latest -o nginx.sbom
-
Run the vulnerability scan on the output:
LOCAL_IMAGE_SCAN=true kubeclarity-cli scan nginx.sbom
6.3 - Remote scanner servers for CLI
When running the KubeClarity CLI to scan for vulnerabilities, the CLI needs to download the relevant vulnerability databases to the location where the KubeClarity CLI is running. Running the CLI in a CI/CD pipeline will result in downloading the databases on each run, wasting time and bandwidth. For this reason, several of the supported scanners have a remote mode in which a server is responsible for the database management and possibly scanning of the artifacts.
Note: The examples below are for each of the scanners, but they can be combined to run together the same as they can be in non-remote mode.
6.3.1 - Trivy
The Trivy scanner supports remote mode using the Trivy server. The Trivy server can be deployed as documented here: Trivy client-server mode.
Instructions to install the Trivy CLI are available here: Trivy install.
The Aqua team provides an official container image that can be used to run the server in Kubernetes or docker, which we’ll use in the examples.
-
Start the server:
docker run -p 8080:8080 --rm aquasec/trivy:0.41.0 server --listen 0.0.0.0:8080
-
Run a scan using the server:
SCANNERS_LIST="trivy" SCANNER_TRIVY_SERVER_ADDRESS="http://<trivy server address>:8080" ./kubeclarity_cli scan --input-type sbom nginx.sbom
Authentication
The Trivy server also provides token based authentication to prevent unauthorized use of a Trivy server instance. You can enable it by running the server with --token flag:
docker run -p 8080:8080 --rm aquasec/trivy:0.41.0 server --listen 0.0.0.0:8080 --token mytoken
Then pass the token to the scanner:
SCANNERS_LIST="trivy" SCANNER_TRIVY_SERVER_ADDRESS="http://<trivy server address>:8080" SCANNER_TRIVY_SERVER_TOKEN="mytoken" ./kubeclarity_cli scan --input-type sbom nginx.sbom
6.3.2 - Grype
Grype supports remote mode using grype-server, a RESTful grype wrapper which provides an API that receives an SBOM and returns the grype scan results for that SBOM. Grype-server ships as a container image, so can be run in Kubernetes or via Docker standalone.
-
Start the server:
docker run -p 9991:9991 --rm gcr.io/eticloud/k8sec/grype-server:v0.1.5
-
Run a scan using the server:
SCANNERS_LIST="grype" SCANNER_GRYPE_MODE="remote" SCANNER_REMOTE_GRYPE_SERVER_ADDRESS="<grype server address>:9991" SCANNER_REMOTE_GRYPE_SERVER_SCHEMES="https" ./kubeclarity_cli scan --input-type sbom nginx.sbom
If the grype server is deployed with TLS, you can override the default URL scheme like this:
SCANNERS_LIST="grype" SCANNER_GRYPE_MODE="remote" SCANNER_REMOTE_GRYPE_SERVER_ADDRESS="<grype server address>:9991" SCANNER_REMOTE_GRYPE_SERVER_SCHEMES="https" ./kubeclarity_cli scan --input-type sbom nginx.sbom
6.3.3 - Dependency track
Generate certificates
First generate a self-signed RSA key and certificate that the server can use for TLS.
openssl req -x509 -nodes -days 365 -newkey rsa:2048 -keyout /tmp/dt.key -out /tmp/dt.crt -subj "/CN=dependency-track-apiserver.dependency-track/O=dependency-track-apiserver.dependency-track"
Create a dependency-track application running in a Kubernetes cluster
-
Create a secret for ingress.
kubectl create ns dependency-track
kubectl create secret tls dtsecret --key /tmp/dt.key --cert /tmp/dt.crt -n dependency-track
-
Deploy nginx ingress controller
helm upgrade --install ingress-nginx ingress-nginx \
--repo https://kubernetes.github.io/ingress-nginx \
--namespace ingress-nginx --create-namespace
-
Deploy dependency-track.
helm repo add evryfs-oss https://evryfs.github.io/helm-charts/
helm install dependency-track evryfs-oss/dependency-track --namespace dependency-track --create-namespace -f values.yaml
kubectl apply -f dependency-track.ingress.yaml
-
Get dependency-track API server LoadBalancer IP
API_SERVICE_IP=$(kubectl get svc -n dependency-track dependency-track-apiserver -o jsonpath='{.status.loadBalancer.ingress[0].ip}')
echo $API_SERVICE_IP
34.69.242.184
-
Update API_BASE_URL environment variable in the values.yaml file with the $API_SERVICE_IP value.
For example, if the service IP is API_SERVICE_IP=34.69.242.184:
    - name: API_BASE_URL
      value: "http://34.69.242.184:80"
-
Upgrade dependency-track to include the new values.
helm upgrade dependency-track evryfs-oss/dependency-track --namespace dependency-track --create-namespace -f values.yaml
kubectl apply -f dependency-track.ingress.yaml
Get ingress LoadBalancer IP
INGRESSGATEWAY_SERVICE_IP=$(kubectl get svc -n ingress-nginx ingress-nginx-controller -o jsonpath='{.status.loadBalancer.ingress[0].ip}')
echo $INGRESSGATEWAY_SERVICE_IP
34.135.8.34
Add a DNS record
Add a DNS record into the /etc/hosts file for the NGINX loadblancer IP address. For example, for INGRESSGATEWAY_SERVICE_IP=34.135.8.34:
$ cat /etc/hosts
##
# Host Database
#
# localhost is used to configure the loopback interface
# when the system is booting.  Do not change this entry.
##
127.0.0.1	localhost
255.255.255.255	broadcasthost
::1             localhost
# Added by Docker Desktop
# To allow the same kube context to work on the host and the container:
127.0.0.1 kubernetes.docker.internal
# End of section
34.135.8.34 dependency-track-apiserver.dependency-track
Test with curl
curl -vvv -k https://dependency-track-apiserver.dependency-track/api/version
Do a test scan
-
Extract the API Key by completing the following steps.
kubectl -n dependency-track port-forward svc/dependency-track-frontend 7777:80 &- Open http://localhost:7777 in your browser. (Username/password is admin:admin)
- Navigate to Administration > Access Management > Teams and get an API Key.
-
Run a test scan. Replace XXX with your API key.
SCANNER_DEPENDENCY_TRACK_INSECURE_SKIP_VERIFY=true \
SCANNER_DEPENDENCY_TRACK_DISABLE_TLS=false \
SCANNER_DEPENDENCY_TRACK_HOST=dependency-track-apiserver.dependency-track \
SCANNER_DEPENDENCY_TRACK_API_KEY=XXX \
kubeclarity-ctl scan sbom.cyclonedx  -i sbom -o sbom-result.json
-
Create a port-forward (replace XXX with your API key).
kubectl --namespace dependency-track port-forward svc/dependency-track-apiserver 8081:80

SCANNER_DEPENDENCY_TRACK_DISABLE_TLS=true \
SCANNER_DEPENDENCY_TRACK_HOST=localhost:8081 \
SCANNER_DEPENDENCY_TRACK_API_KEY=XXX \
kubeclarity-ctl scan sbom.cyclonedx  -i sbom -o sbom-result.json
Cleanup
If you want to delete dependency-track and the related resources, run the following commands.
helm uninstall dependency-track -n dependency-track
helm uninstall ingress-nginx -n ingress-nginx
kubectl delete ns dependency-track ingress-nginx
7 - Private registry support
7.1 - Private registry support for the CLI
The KubeClarity CLI can read a configuration file that stores credentials for private registries. (For details, on using an external configuration file, see Set configuration file location for the CLI).
Example registry section of the configuration file:
registry:
  auths:
    - authority: <registry 1>
      username: <username for registry 1>
      password: <password for registry 1>
    - authority: <registry 2>
      token: <token for registry 2>
Example registry configuration without authority: (in this case these credentials will be used for all registries):
registry:
  auths:
    - username: <username>
      password: <password>
7.2 - Private registry support for Kubernetes
KubeClarity uses k8schain for authenticating to the registries. If the necessary service credentials are not discoverable by the k8schain, you can define them as secrets as described below.
In addition, if service credentials are not located in the kubeclarity namespace, set CREDS_SECRET_NAMESPACE to kubeclarity Deployment.
When using Helm charts, CREDS_SECRET_NAMESPACE is set to the release namespace installed kubeclarity.
Amazon ECR
-
Create an AWS IAM user with AmazonEC2ContainerRegistryFullAccess permissions.
-
Use the user credentials (AWS_ACCESS_KEY_ID, AWS_SECRET_ACCESS_KEY, AWS_DEFAULT_REGION) to create the following secret:
cat <<EOF | kubectl apply -f -
apiVersion: v1
kind: Secret
metadata:
  name: ecr-sa
  namespace: kubeclarity
type: Opaque
data:
  AWS_ACCESS_KEY_ID: $(echo -n 'XXXX'| base64 -w0)
  AWS_SECRET_ACCESS_KEY: $(echo -n 'XXXX'| base64 -w0)
  AWS_DEFAULT_REGION: $(echo -n 'XXXX'| base64 -w0)
EOF
Note:
- The name of the secret must be
ecr-sa - The secret data keys must be set to
AWS_ACCESS_KEY_ID, AWS_SECRET_ACCESS_KEY, and AWS_DEFAULT_REGION
Google GCR
-
Create a Google service account with Artifact Registry Reader permissions.
-
Use the service account json file to create the following secret:
kubectl --namespace kubeclarity create secret generic --from-file=sa.json gcr-sa
Note:
- Secret name must be
gcr-sa sa.json must be the name of the service account json file when generating the secret- KubeClarity is using application default credentials. These only work when running KubeClarity from GCP.
8 - Set configuration file location for the CLI
The default configuration path of the CLI is $HOME/.kubeclarity. To specify a different file, use the --config flag, like this:
kubeclarity-cli <scan/analyze> <image name> --config <kubeclarity config path>
For example:
kubeclarity-cli scan registry/nginx:private --config $HOME/own-kubeclarity-config
9 - Merge scan results
You can merge SBOM and vulnerabilities scan results into a single file. For example, you can merge the scan results across different CI/CD stages.
To merge an existing SBOM into the final results, use the --merge-sbom <existing-sbom-file> flag during analysis. The input SBOM can be in CycloneDX XML or CyclonDX JSON format. (For details on output formats, see SBOM output format).
For example:
ANALYZER_LIST="syft" kubeclarity-cli analyze nginx:latest -o nginx.sbom --merge-sbom inputsbom.xml
10 - KubeClarity development
Building KubeClarity
make build will build all of the KubeClarity code and UI.
Makefile targets are provided to compile and build the KubeClarity binaries.
make build-all-go can be used to build all of the go components, but also
specific targets are provided, for example make cli and make backend to
build the specific components in isolation.
make ui is provided to just build the UI components.
Building KubeClarity Containers
make docker can be used to build the KubeClarity containers for all of the
components. Specific targets for example make docker-cli and make docker-backend are also provided.
make push-docker is also provided as a shortcut for building and then
publishing the KubeClarity containers to a registry. You can override the
destination registry like:
DOCKER_REGISTRY=docker.io/tehsmash make push-docker
You must be logged into the docker registry locally before using this target.
Linting
make lint can be used to run the required linting rules over the code.
golangci-lint rules and config can be viewed in the .golangcilint file in the
root of the repo.
make fix is also provided which will resolve lint issues which are
automaticlly fixable for example format issues.
make license can be used to validate that all the files in the repo have the
correctly formatted license header.
Unit tests
make test can be used run all the unit tests in the repo. Alternatively you
can use the standard go test CLI to run a specific package or test by going
into a specific modules directory and running:
cd cli
go test ./cmd/... -run <test name regex>
Generating API code
After making changes to the API schema for example api/swagger.yaml, you can run make api to regenerate the model, client and server code.
Testing End to End
End to end tests will start and exercise a KubeClarity running on the local
container runtime. This can be used locally or in CI. These tests ensure that
more complex flows such as the CLI exporting results to the API work as
expected.
Note:
If running Docker Desktop for Mac you will need to increase docker daemon
memory to 8G. Careful, this will drain a lot from your computer cpu.
In order to run end-to-end tests locally:
# Build all docker images
make docker
# Replace Values In The KubeClarity Chart:
sed -i 's/latest/${{ github.sha }}/g' charts/kubeclarity/values.yaml
sed -i 's/Always/IfNotPresent/g' charts/kubeclarity/values.yaml
# Build the KubeClarity CLI
make cli
# Move the Built CLI into the E2E Test folder
mv ./cli/bin/cli ./e2e/kubeclarity-cli
# Run the end to end tests
make e2e
Sending Pull Requests
Before sending a new pull request, take a look at existing pull requests and issues to see if the proposed change or fix
has been discussed in the past, or if the change was already implemented but not yet released.
We expect new pull requests to include tests for any affected behavior, and, as we follow semantic versioning, we may
reserve breaking changes until the next major version release.